
SORBUS Spotlight: The US Economy: A Stock Take
The US remains the world’s most important economy and continues to set the mood and tone for financial markets. This month’s spotlight takes a deeper dive into the current state of the American economy on five key metrics.
GROWTH
source: SORBUS PARTNERS, ONS (data as at:31/07/2026)
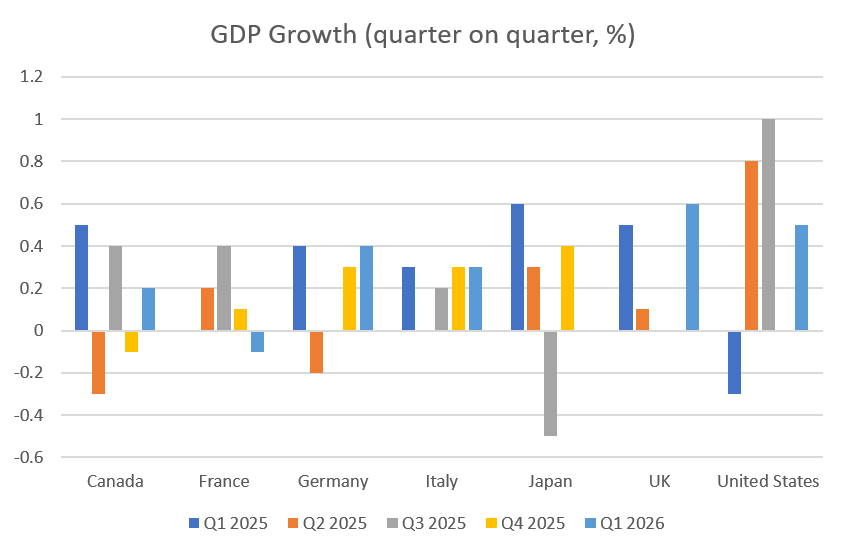
There are two ways to look at US growth over the last 18 months or so: either it has been very strong or excellent.
Taking the more pessimistic approach first, the US has consistently outgrown its major advanced economy peers over the course of 2025 and into 2026. While growth may not be especially strong compared to the longer sweep of US history, it certainly looks good in the more volatile world of the 2020s. The kind of growth the US has enjoyed has been the kind of thing which would set hearts aflame in European finance ministries.
But a decent case can be made that the US performance is even better than this chart suggests.
Consider the obstacles placed in the way of economic performance over the last 18 or so months:
- Extreme trade policy uncertainty over the course of 2025. US tariff levels have bounced around a great deal, often changing more than once a week during periods of tension. All things being equal economic uncertainty tends to reduce investment and hiring as plans are put on pause or cancelled.
- The tariff level has been hiked to its highest level since the 1940s. That raises costs for US importers and households.
- Two long periods of government shutdown. Traditionally such shutdowns, which follow budget standoffs, have reduced economic activity as government spending is paused and workers temporarily laid off.
- A large crack down on immigration and a high level of deportations. Whatever the longer run effect, in the short term one would expect a smaller pool of workers available to firms (often at low wages) to have some negative impact on growth.
In other words, the headline US growth numbers look strong but when one remembers all of the policy induced problems that US firms have had to work around, they look truly excellent.
It may be that the US economy has more underlying momentum than the headline figures suggest.
INFLATION
source: SORBUS PARTNERS, FRED (data as at:31/07/2026)
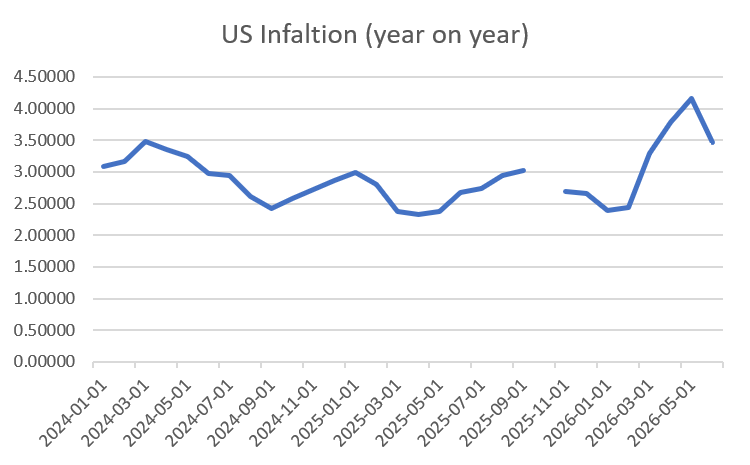
When it comes to price pressures, the news is less good (and note that the missing entry for October 2025 reflects a period of government shutdown when no estimate was produced).
It looked, in early 2024, as if inflation would continue to grind back down towards the Fed’s 2% target but – since the middle of 2024 – progress has paused. Inflation sat around the 2.5-3% mark throughout most of 2025 and has accelerated in recent months.
The recent bounce is, of course, mostly a fuel prices story driven by events in the Middle East, but the broader point is that, even excluding oil prices, US inflation remains uncomfortably above target. Tariffs have undoubtedly played a role here.
Core inflation, excluding volatile food and energy prices, has been around the 2.5% mark for more than a year.
This has always been hard to square with the notion that the Fed would be able to cut rates in the months ahead. The best that can be said is that, oil prices aside, US inflation does not seem to be accelerating.
THE JOBS MARKET
source: SORBUS PARTNERS, FRED (data as at:31/07/2026)
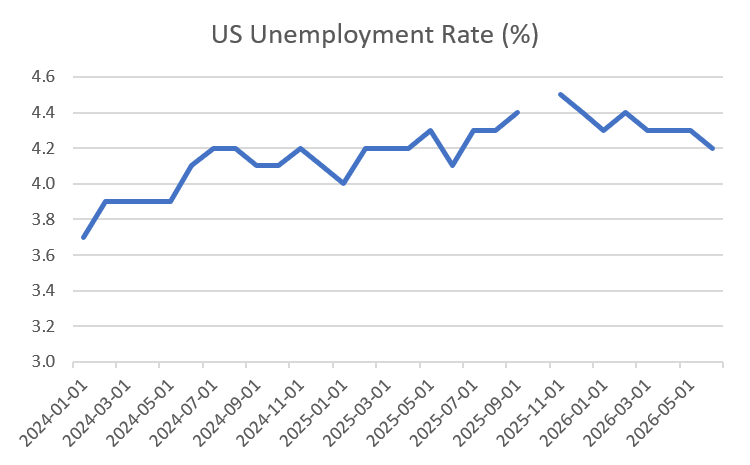
The US jobs market proved exceptionally hard to read in recent years.
Over the course of 2024 and 2025 the unemployment rate continued to gradually drift higher, suggesting some sort of loss of momentum, but in recent months it has headed down again.
On the other hand, new hiring appears weak and the fall in unemployment has been driven more by fewer firings and quits than by higher hiring, and by more people choosing to become economically inactive – an unusual pattern.
Despite falls in the headline jobless rate, the overall labour market does not look especially hot. More generally health and social care, education and professional services continue to add jobs while the leisure and hospitality and retail sectors shed them.
Wage growth has remained steady at around 3%. The hot labour market of 2021-2023 looks to be well in the past with things cooling, but at a gradual pace. The real difficulty is squaring this picture of a more tepid jobs market with continuing above target inflation and relatively fast economic growth.
PRODUCTIVITY
source: SORBUS PARTNERS, FRED (data as at:31/07/2026)
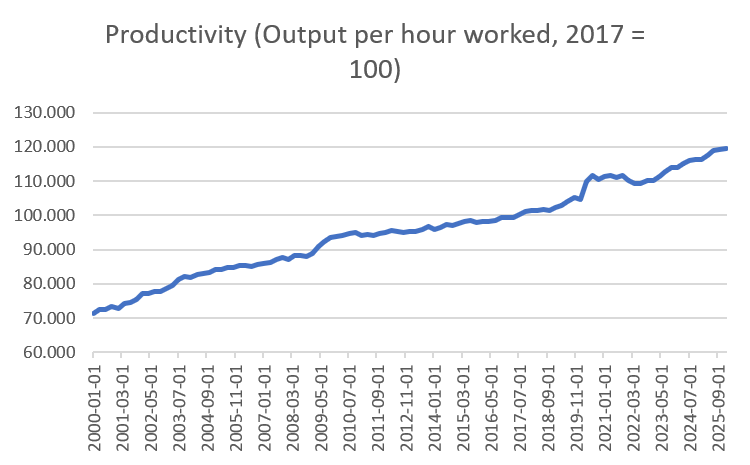
The outlook for US productivity is, perhaps, the biggest medium term question facing the economy.
And on one level, the recent numbers look good. Indeed, since 2024 productivity growth has returned to levels not witnessed (outside of recessions when job losses tend to mean productivity is artificially increased in the short run) since the mid 2000s.
Kevin Warsh, is hopeful that this may reflect the impact of AI beginning to appear in the data. Maybe.
But a recent paper from Fed researchers made a convincing alternative case, based on taking a close look at US spare capacity data:
Intensity rather than efficiency may be driving the recent US productivity acceleration. Higher utilisation can account for essentially all of the exceptional rise in productivity growth over the past two years without any acceleration in underlying technological progress. AI could have mattered indirectly, by raising demand and uncertainty and pushing firms to work existing inputs harder rather than adjust them. That channel raises costs as it raises output. For now, the measured productivity gains appear to derive from “working harder” rather than “working smarter”.
In other words, the authors reckon that the recent bounce in productivity has been driven by firms working their existing resources harder rather than through innovation.
Of course, AI might lead to further increases in the years ahead but there is likely a limit to how much existing assets can be sweated.
INVESTMENT
source: SORBUS PARTNERS, FRED (data as at:31/07/2026)
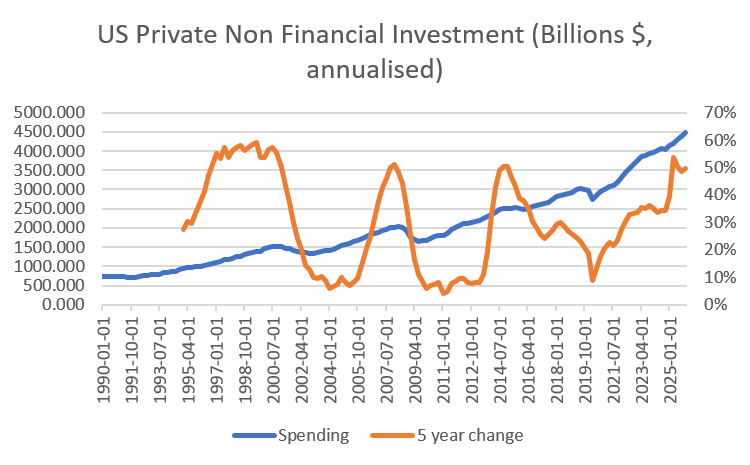
US investment spending is booming – driven, in particular by the so-called hyperscalers and the building of new data centres to provide the computing power necessary to support AI.
The blue line above is the quarterly total of private investment spending (annualised) whilst the orange line shows the percentage change over a five year period.
Notably, over the last thirty-five or so years, the five year change in investment spending has only reached current levels on three occasions. Two of those (the mid 2010s and the late 2000s) represent the bounce back from previous recessions (namely the financial crisis of 2007-09 and the dot com bust of 2001-03). The other occasion, in the mid to late 1990s was the height of the dot com bubble when investment in telecommunications equipment soared.
The scale of the current datacentre boom can be hard to grasp. Apollo, the asset manager, estimates that just five firms (Alphabet, Meta, Oracle, Microsoft, Amazon) alone will spend more than $600bn this year on capital expenditure. That is more than 2% of US GDP and around three times more than they invested in 2024.
This heavy spending has been an important prop to US growth, but is also having a wider impact on financial markets, all things being equal, higher demand for funds to invest should push interest rates up.
Some of the bigger questions for 2026-2028 are (i) how long will this spending boom continue and (ii) when will all this new investment start to feed through into a better productivity performance?
In summary, the US economy has performed – on the top line of GDP growth – remarkably well despite all sorts of potential spanners being thrown into the works over the last 18 months. But, just under the surface, there are plenty of grounds for concern – inflation remains uncomfortably elevated, there are questions about how much longer productivity can continue to improve, the jobs market is cooling and investors are fretting about how sustainable the capital expenditure boom will prove to be.