The Oracle speaks
In the days before international coordinated banking regulation it was often claimed that the Governor of the Bank of England merely had to raise his eyebrow in an expression of displeasure and the recipient bank would get the message and stop misbehaving.
Central bankers retain an extraordinarily powerful role, particularly since the financial crisis, but their complicity in allowing the financial crisis to emerge has tarnished their collective reputation. They may retain the keys to the bank note printing press but they are no longer lauded and the proof of their fallibility is mounting.
Most recently Janet Yellen, the new Chair of the Federal Reserve, has undermined her credibility by saying “Overall … indicators do not obviously point to significant excesses or imbalances in the United States. … forward price-to-earnings ratios in the stock market fall within the ranges prevailing in recent decades, and are well below the early-2000 peak.”
On first sight this appears to be relatively benign comment, but it has aroused some fairly severe criticisms:
“This is nonsense” Andrew Smithers
“Either she’s painfully ill-informed or, most implausibly, not too smart, in which case sooner or later we’re screwed, or she knows this measure is a third-rate prediction of true value and is cynically using it to tout the market, in which case we’re doubly screwed!” Jeremy Grantham
(The reference to touting the market refers to one of the stated aims of the Fed’s QE policy of pushing up asset prices in the hope that of making people feel wealthier, so inducing them to spend more and thus promoting economic recovery/growth.)
The problem with Yellen’s comments was not about the price-to-earnings ratio being currently within historical norms, it is because the price-to-earnings ratio is inaccurate both as a measure of valuation and as an indicator of short term market movements. She should know better.
The PE ratio is one of the most commonly used measures to determine the attractiveness (or not as the case may be) of current share prices as an investment. It is simply the market value of the company (price) divided by its net profits after tax (earnings). So for example a company with a stock market value of £100m and earning annual net profits of £10m would have a PE of 10.
The number can be based on the most recent year’s declared profits (historic) or the next year’s profit based on analysts’ forecasts (prospective). This PE measure is also calculated for stock markets as a whole as well and is published in the financial papers on all the major stock market indices on a daily basis. The PE ratio for the FTSE100 is currently 14.2. This can then be compared with data over the past century to give investors an indicator of where current values stand in an historical context. This is then widely quoted by analysts and market commentators in their prognostications about markets.
The problem is that there is a significant quantity of academic research which shows that prospective PE is actually a very poor predicator of both short term and long term market performance and returns.
The primary reason is that “e” in the PE (earnings) can vary enormously depending on where we are in the business cycle. If profit margins are substantially above the norm (usually at the peak of the cycle) and consequently corporate profitability is high then the prospective PE can give a false indication of reasonable value.
As an example let’s say that a hypothetical company, Acme Widgets, has a cyclical profit margin that rises in the good years but falls in the bad years. In a good year it is valued at £100m and makes £12m of profits: a PE of 8.3. In a bad year the company is only valued at £80m and it makes profits of £6m: a PE of 13.3. If high PE’s are a sign of investments being expensive then investors would be selling Acme Widget shares when the company is valued at £80m and buying shares when it is worth £100m.
A secondary problem is that prospective PE ratios are by definition relying on future earnings which are presently unknown. In order to calculate them analysts construct profits forecast which are notoriously unreliable – they tend to herd together and exaggerate the extent of profits growth.
However this clearly begs the question, if next year’s prospective PE is a poor guide in determining if markets are cheap or expensive, what other measures have a more accurate forecasting record?
Robert Shiller is a US economist, academic and writer. His book Irrational Exuberance warned that the stock market had become a bubble in March 2000 (the very height of the U.S. stock market) which could lead to a sharp decline. This was based on his Cyclically Adjusted Price Earnings Ratio (CAPE). Instead of using just one year’s earnings forecast, he took the previous 10 years earnings and produced an average figure adjusted for inflation. This has the effect of smoothing out the natural fluctuation in corporate earnings due to the economic cycle and profit margins. Whilst not perfect, it has a much better correlation with long term returns than just one year’s measure as per Janet Yellen et al.
Other measures that are better predictors include using dividend yields, bond ratios and (most accurately) “q”, a variant of Tobin’s “q”, which in simple terms analyses whether it is cheaper to buy a company or to build it from scratch; if it is cheaper to build it then the company is overvalued. Interestingly even historic PE’s are more accurate than prospective PE’s which shows that it really is better to completely ignore the analysts!
The bad news is that the current CAPE for the U.S stock market is currently 25.6 compared with the long term average of 16.5. In addition it is incorporating profit margins substantially higher than the long term average.
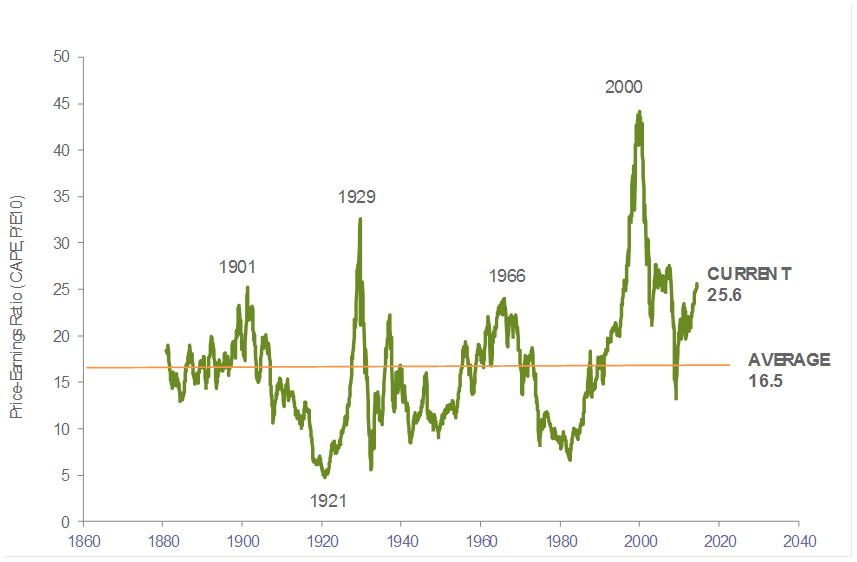
This suggests both that US equity valuations are too expensive and that profits margins are likely to fall. However it is important to stress that valuation is not, and has never been, a short term timing tool: even though markets may be overpriced, they can press on significantly higher for a prolonged period of time and it does not usually pay to actively bet against such momentum . As the great economist John Maynard Keynes stated, “The market can stay irrational longer than you can stay solvent”.
As can be seen from the above graph the CAPE peaked at 44, the highest on record and even higher than before the Wall Street crash of 1929. Of course the aftermath of this was a subsequent 50% + drop in the U.S. stock market and other global markets (though it is important to point out that this was skewed by technology stocks – many “old economy” companies had been immune to the bubble and the aftermath).
If you pay a high price for an asset then inevitably your future returns are reduced. It is not inconsistent to state that stock markets could well go higher in the short term but investors should prepare themselves for lower than average long term returns from equities from here.
ALAN GREENSPAN: Well, remember that what an ideology is, is a conceptual framework with the way people deal with reality. Everyone has one. You have to — to exist, you need an ideology. The question is whether it is accurate or not. And what I’m saying to you is, yes, I found a flaw. I don’t know how significant or permanent it is, but I’ve been very distressed by that fact.
REP. HENRY WAXMAN (D), California: You found a flaw in the reality…
ALAN GREENSPAN: Flaw in the model that I perceived is the critical functioning structure that defines how the world works, so to speak.
REP. HENRY WAXMAN: In other words, you found that your view of the world, your ideology, was not right, it was not working?
ALAN GREENSPAN: That is — precisely. No, that’s precisely the reason I was shocked, because I had been going for 40 years or more with very considerable evidence that it was working exceptionally well.
Alan Greenspan was apparently so vehemently against the idea of trying to second guess free markets that he apparently banned the use of or discussion of the word “bubble” among his staff during his tenure at the Fed. Once much praised, he was accorded the same degree of adoration as a rock star, his every utterance pored over by market observers for clues (he once said “I guess I should warn you, if I turn out to be particularly clear, you’ve probably misunderstood what I’ve said”.) However his unprecedented five terms as Governor of the Federal Reserve are now viewed in a more sober light as being the architect, through his easy money policy of low interest rates, of both the U.S housing and stock market bubbles, which the bursting of which led to what is now termed “the great recession”. He eschewed any attempt to stop, or spot asset prices were venturing into such elevated territory they might pose a systemic risk to the economy.
REP. DENNIS KUCINICH (D), Ohio: Now, Mr. Greenspan, before the collapse of the housing bubble, didn’t you also say that the U.S. has not experienced housing slumps to justify your policy that there would be no bubble? And can you tell this committee when it occurred to you that there was a housing bubble?
ALAN GREENSPAN: I knew — the housing bubble became clear to me sometime in early 2006, in retrospect. I did not forecast a significant decline because we had never had a significant decline in prices. When central bankers speak consideration should be given to their fallibility.