SORBUS spotlight: China Watch
Spotlight tries to make a habit out of casting a closer look at China at least once every six to eight months. The reason for this is simple: China is too large to ignore. Or at least in economic terms, it is too large to ignore. In purely financial terms, the closed nature of its capital market means it tends to punch under its weight when it comes to its direct impact on global asset markets. But whilst the global economic and financial cycles can occasionally diverge, they remain intimately bound together. And for that reason, investors more concerned with financial returns than global economic developments cannot afford to ignore the Chinese cycle.
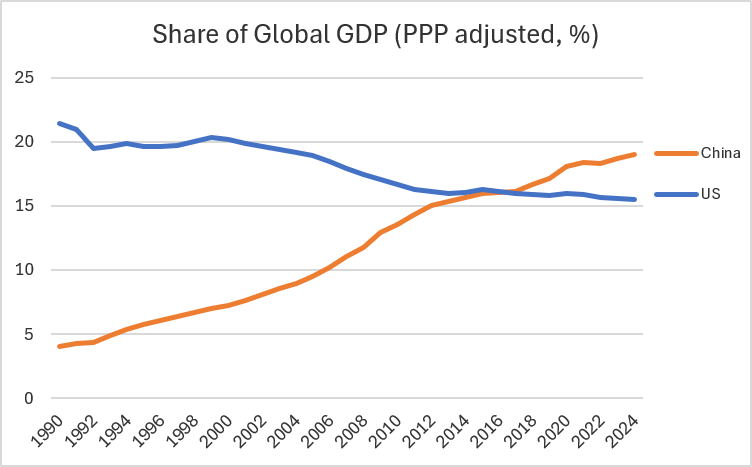
As Spotlight has noted before, the pace of Chinese economic development over the past three decades has been little short of spectacular. The best way to visualise it is via the chart below.
source: SORBUS PARTNERS LLP, IMF World Economic Database (data as at: 17/09/2024)
This shows the US and Chinese economies as a share of total global output (GDP) using purchasing price parity (PPP) adjustment. That is to say, rather than using simple dollar totals of GDP rates it adjusts those totals relative to the differing price levels across nations. In this manner, PPP adjusted figures give a better picture of actual economic output – they try to ensure that, say, a car produced in China is scored the same as a car produced in Europe or the United States, even though (given lower wages) the Chinese car was probably produced at a lower cost.
Such measures are rarely exact, but they are in the right sort of ballpark. Using the International Monetary Fund’s data the trend is obvious. Thirty odd years ago China produced around 5% of global output and the USA more than 20%, nowadays China has edged ahead.
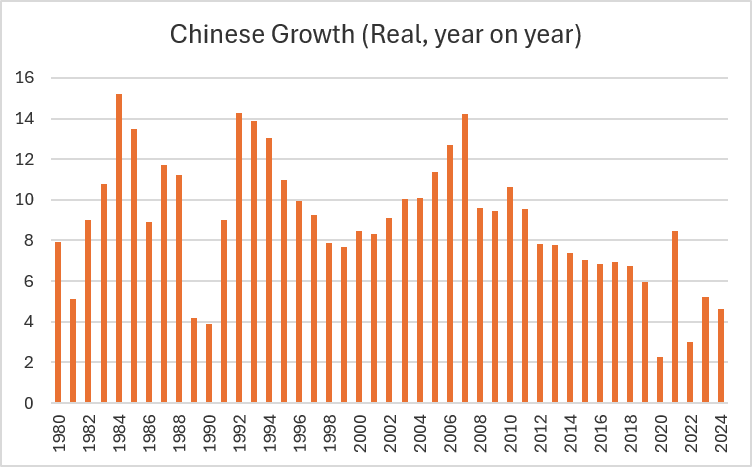
The fact that China is now a much larger share of the global economy comes as no surprise and nor is the fact that Chinese growth has slowed sharply in recent years.
source: SORBUS PARTNERS LLP, International Monetary Fund, World Economic Outlook Database, April 2024
In the decade after 2010 Chinese annual growth rates slipped down from around 8% per annum to closer to 6%. After the pandemic they have struggled to get much above 5%.
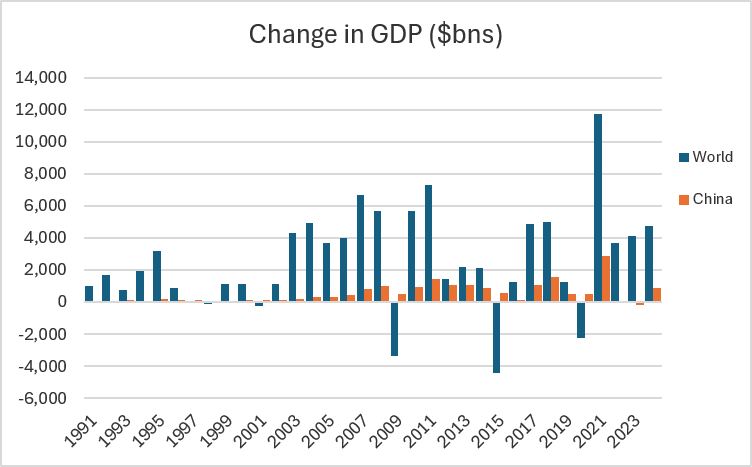
A point not always grasped though is that weaker growth of the late 2010s, or even the post-pandemic performance, has been a bigger deal globally than the rapid ascent of the 1990s or the 2000s. Simply put, an economy worth more than $17 trillion growing at 4% or 5% produces a lot more marginal global growth than one worth less than $1 trillion growing at 10% plus.
The third chart tries to capture this effect.
source: SORBUS PARTNERS LLP, IMF World Economic Database (data as at: 17/09/2024)
It shows the total growth of the global economy each year (expressed in current US dollars) and the change in Chinese GDP (also in dollars) over the same period. No adjustments have been made for purchasing power parity, inflation or changing foreign exchange rates – so the numbers need to be treated with caution. But they at least give a good steer on how important Chinese growth has been to global economic expansion over the past few decades. In the 1990s and 2000s even as the Chinese growth rates soared, it contributed a relatively small share of total global growth. By contrast in the 2010s, even though headline growth was weaker, China was regularly responsible for 40% or more of all global growth.
The Chinese motor though has been spluttering in recent years.
Partially that reflects a change in policy in Beijing. In the 1990s and 2000s and into the early 2010s, the aim was simply growth and this growth was often powered by investment. Local authorities and state owned companies ramped up capital expenditure and property construction, often funded by cheap loans from state owned banks. In the second half of the 2010s, with more than 80 million residential units vacant across the country, an attempt was made to change the character of growth. The emphasis now was on slowly growing household consumption, on boosting the service sector and trying to transition away from something reliant on funnelling cheap lending towards favoured projects. Whilst headline growth slowed, it was – at least in theory – of a higher quality.
That thought was derailed by the pandemic. China took an exceptionally hard line on preventing the spread of covid, pioneering the kind of lock-downs later used in the West but being far more frequent in their use. On-again, off-again local lockdowns (often covering millions of households) lasted well into 2022.
Since 2021 China has found itself with weaker growth, large debt balances and excess capacity across many industries. How the country responds will be a major determinant of the global economic outlook for the later half of the 2020s.
China’s importance to the global economy stretches well beyond the fact that it is now a much larger component of it than in the past – it is also much more plugged into global supply chains.
The Lowry Institute, an Australian geopolitics focussed think tank, recently catalogued the extent of this. As they noted, comparing 2001 (the year China joined the World Trade Organisation) to 2018 (the last year for which full global trade figures between all nations are available) shows a stark change in trading patterns:
In 2001, the year China acceded to the World Trade Organisation, over 80% of countries with data available had a larger volume of trade with America than China. By 2018, that figure was down to a little over 30% – with two-thirds of countries (128 out of 190) trading more with China than the United States.
Equally important, 90 countries (almost half) traded more than twice as much with China as with America.
Twenty years ago, the United States was the trading partner that ultimately mattered to many nations, nowadays it is more likely to be China.
And China’s trade surplus is once again rising.
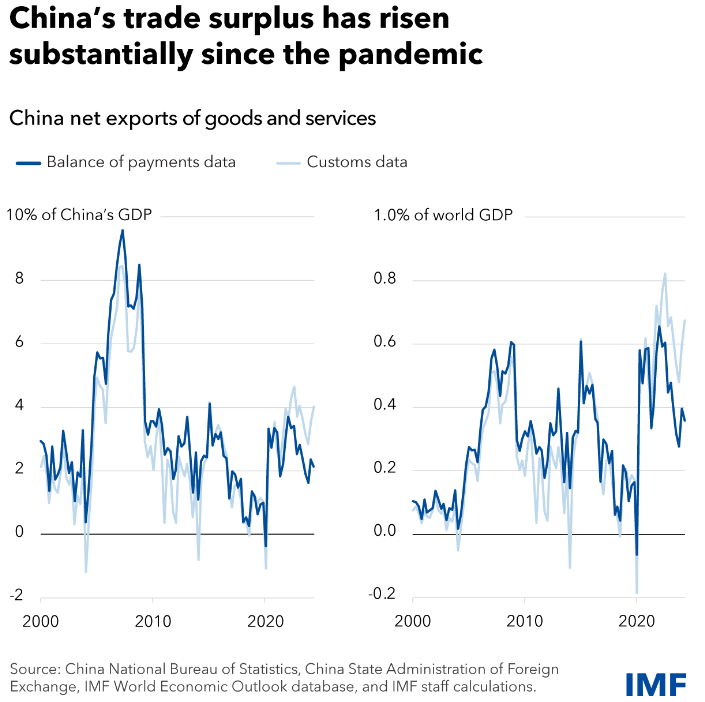
Across Asia, Africa, Latin America and in more than half of European nations China is now a larger partner than the United States. And yet China’s capital markets remain mostly closed to outsiders and the Yuan plays a negligible role in global finance. The dollar is still king when it comes to global finance.
US interest rates exercise a major influence on the outlook for vast swathes of the global economy and financial conditions in Britain, Europe and most major emerging markets take their cues from what is happening in American markets.
This then is the real vulnerability of the global economy in the 2020s: for many countries their real economic cycle is now more impacted by what is happening in China than the United States but their financial cycles remain American-led. Twenty years ago the United States had an impact on economic cycles just as large as its impact on financial ones, but this is no longer the case in many countries.
The potential is there for a disconnect.
Indeed Chinese financial markets are so isolated from the wider global picture that they rarely get the attention they deserve.
This month saw a little noted but potentially major development. For the first time in at least decades, and possibly longer, Japanese long-dated government bond yields are higher than Chinese ones.
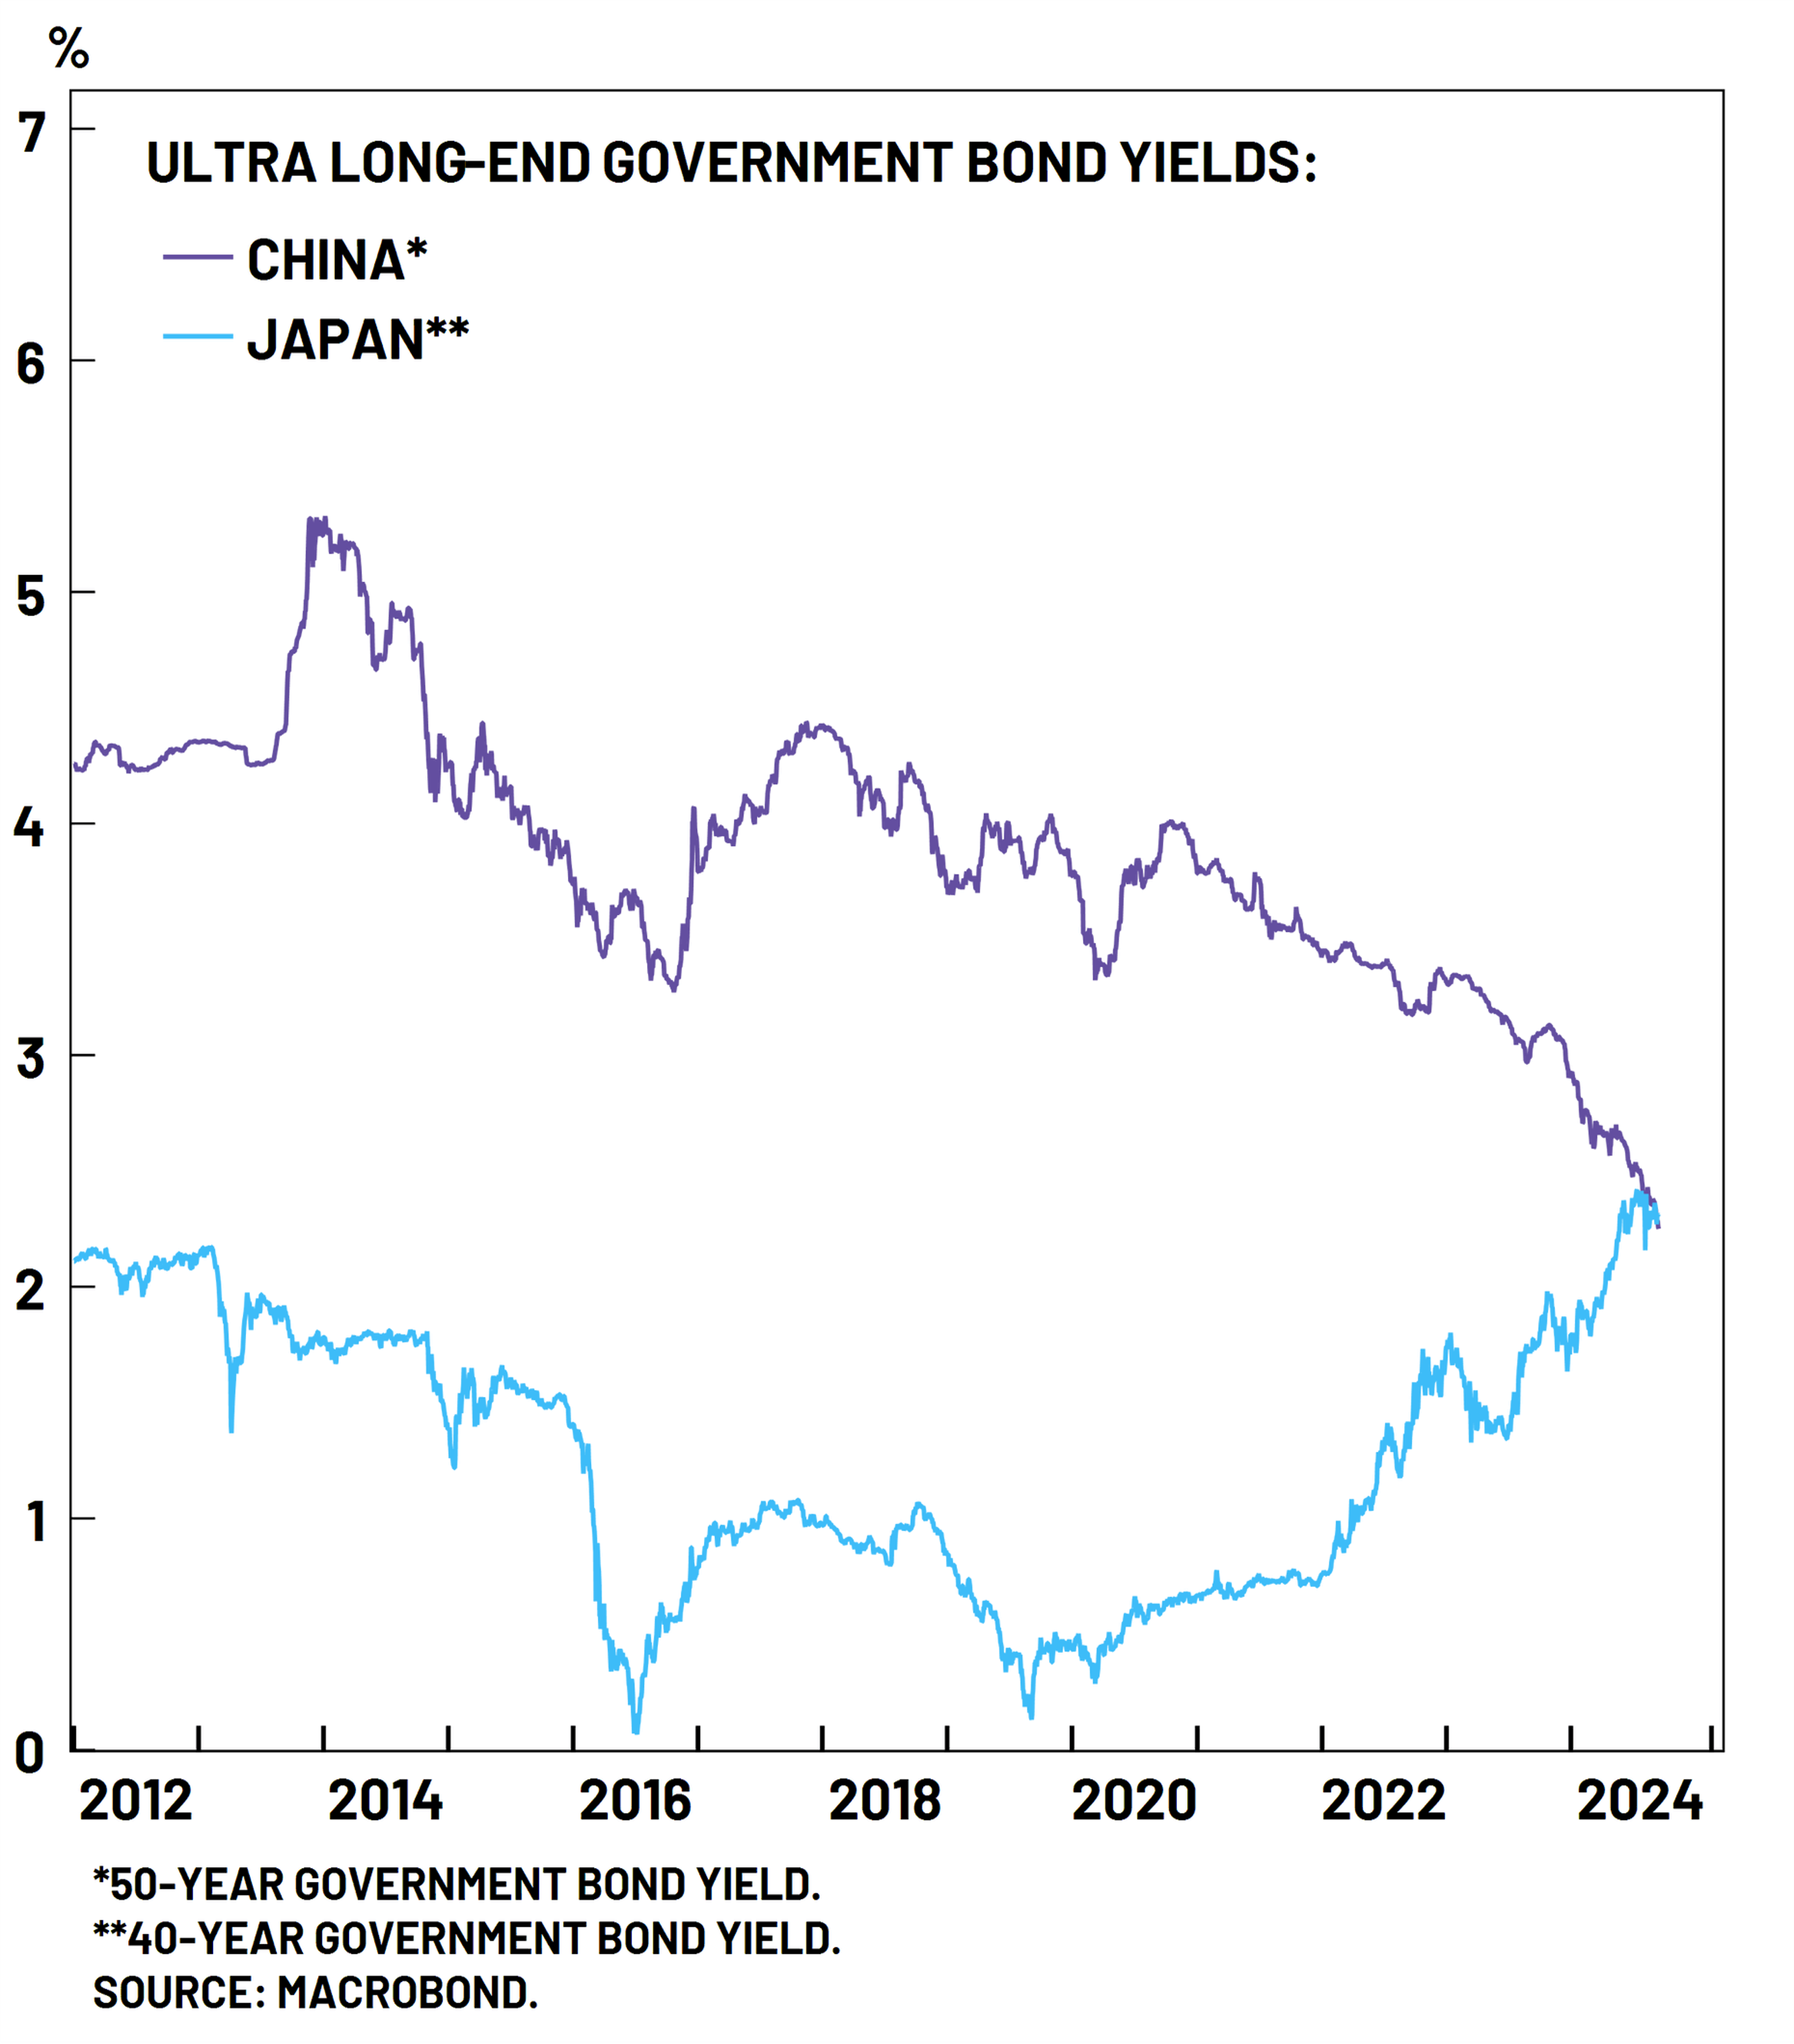
That is partially a story of reflation and (very slowly) rising interest rates in Japan. But as the chart makes clear it is also a story of declining long-bond yields in China, especially since 2020.
It is hard to read that as anything other than a bearish signal on Chinese growth prospects. With China’s demographics on the turn – and heading in a distinctly Japanese direction – markets are signalling that growth and inflationary pressure will be weaker in the decades ahead and that excess savings will weigh down on borrowing costs. Whilst China may escape the two lost decades of growth that Japan endured, output growth will likely become more sluggish in the years ahead.
That matters for the wider global economy for at least three reasons. The first, and most obvious one, is that China has been an important prop to overall global growth in recent decades. That can no longer be relied upon to continue. The second is that it is now a major trading partner for economies across continents and, as it slows, it may drag down their performance too. The disconnect between the Chinese real cycle and the US financial one adds a new vulnerability to growth. Thirdly though, the country’s leaders are likely to respond to excess capacity in their own industries by attempting to export away some of the surplus. That adds to rising trade tensions, the push to protectionism and general global geopolitical risk.
In the short term, watching the US closely matters for global financial returns but in the longer term what happens in the global economy is decided as much by Beijing as Washington.
|
What we are watching. RBA rate decision, 24th September – The Reserve Bank of Australia is, by no one’s definition, a major player in global markets. But in recent months it has become interesting. Alongside the Norwegian Norges Bank it has become a relative global hawk simply by not joining in with the cuts of its peers. Among the Western central banks it is also the home to the best China watchers – given Australia’s large trade linkages with Beijing this is hardly a surprise. Its views on the China outlook are always worth following. US GDP and durable goods, 26th September – The 26th sees a lot of US data released – GDP for the 2nd quarter, more timely durable goods sales data (the best source on US capital expenditure trends) and PCE inflation (the Fed’s preferred measure). The Fed is now embarking on an easing cycle and the big question is how far this will go – the data released on this date will give them early clues. China manufacturing data, 30th September – Chinese data is becoming ever less reliable. The private sector compiled Caixan Manufacturing survey is now the most timely measure of developments in this crucial sector. |