SORBUS spotlight: Britain’s Inflation Problem
One golden rule of macroeconomic analysis is to never overreact to a single datapoint. There is always a degree of randomness in any monthly statistical release and the odd blip should not be taken as the start of a new trend. But two ‘blips’ in a row start to look a little more concerning.
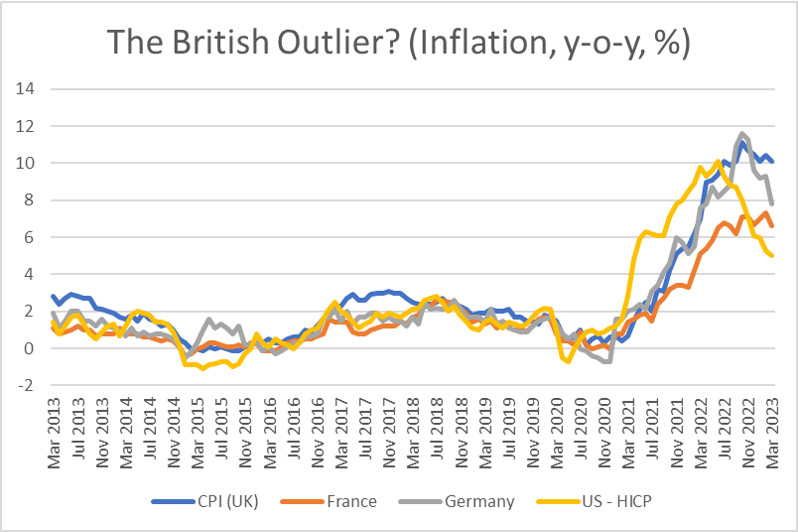
For the past two months, British inflation data from the Office for National Statistics has come in well ahead of analyst expectations. It was not supposed to be like this. Both the Bank of England and the Office for Budget Responsibility forecast – in February and March respectively – that inflation was on a glide path lower. Instead, whilst British inflation is remaining stubbornly stuck in the double digits, inflation in the other advanced economies is falling quicker.
source: SORBUS PARTNERS, Office for National Statistics (data as at: 01/05/23)
That is enough to start raising worrying questions about if Britain’s inflation problem has become more entrenched than that of its peers and if so, why? Given that other countries have been exposed to the same energy price shocks and post-pandemic supply disruptions, it is becoming harder to point to external factors as the major driver.
Nor can another usual suspect be held to account. Over the last couple of decades, global inflation rates across the advanced economies have usually moved, more or less, in tandem. French inflation, for example, has tended to be rising when US inflation is – often because of developments in global commodity markets or driven by events further down global supply chains in China and East Asia.
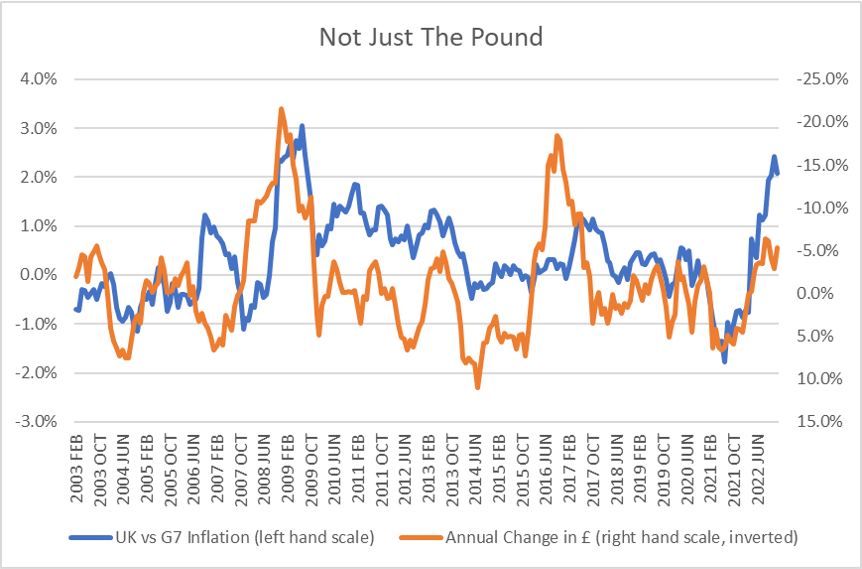
Periods of British divergence from global trends have usually been associated with the fluctuating value of sterling.
source: SORBUS PARTNERS, Office for National Statistics (data as at: 01/05/23)
The chart above compares the difference between British and G7 inflation to the change in the value of the pound over the preceding year. The times when British inflation has been much higher than in comparable economies – such as after the banking crisis in 2008 or after the referendum in 2016 have usually been associated with a weak pound. That makes perfect sense, given most global supply chains and commodity markets are priced in dollars, any weakness in sterling has the capacity to magnify the impact of global price shocks for British firms and households.
But this time it looks a little different. Whilst the pound has lost around 5% of its value over the past year – against a breadbasket of other currencies – the fall does not seem large enough to explain away the increasing divergence in inflation rates.
In other words, neither global factors nor a weak currency can really help to make sense of why British inflation looks to be on a different path to US or European inflation. Instead one must turn to domestic factors.
It helps at this point to dive deeper into the British data.
source: SORBUS PARTNERS, Office for National Statistics (data as at: 01/05/23)
Economists tend to prefer, whenever possible, to set aside headline inflation and instead concentrate on so-called core inflation, which excludes volatile components such as food and energy. Of course for firms and households facing soaring energy and food prices, this can seem strange at best and perverse at worst. But given such prices are driven by global factors, core inflation should, in theory, give a better read on domestic price pressures.
That theory is being tested to destruction by the scale of the energy price moves seen in the last two years. There has no doubt been a great deal of leakage from energy prices into other categories as all sorts of firms, from pubs to manufacturers, have been forced to raise prices to protect margins against soaring energy bills.
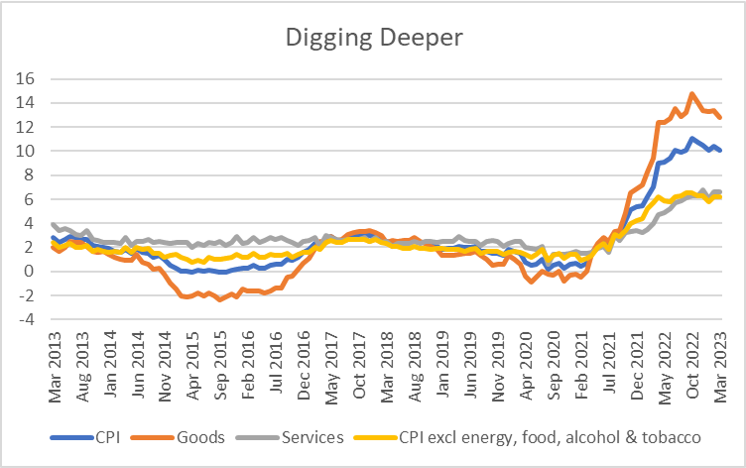
Core inflation in Britain does look relatively stable at around 6% per year but that remains the highest sustained rate since the early 1990s. For most of the last two decades, despite two bouts of high inflation in Britain around 2008 and 2016, core inflation never advanced more than 2.7%. Given the Bank of England’s target of 2%, core inflation being three times that level cannot be regarded as anything short of disastrous.
Although the traditional approach is to look at core inflation as the best way to measure domestic price pressures, in the British case a simple look at services vs goods prices often gives a clearer signal. Whilst goods markets are generally closely integrated and tradeable globally, services are more domestically focused.
The standard picture for Britain has been low, or sometimes even negative, goods price inflation, driven by China’s integration into the global economy and global deflationary forces, coupled with slightly higher service prices. Given that each of these two represent around half of the total basket that the Office for National Statistics uses to calculate overall consumer price inflation, it has been perfectly possible to have services price inflation running at, say 3%, as long as goods price inflation was only 1% and still have overall inflation of 2%.
The big pick-up in services price inflation over the course of 2021 and 2022 is what has driven the Bank of England into its policy of aggressively raising rates.
So what comes next?
The picture for goods prices is more straightforward. Unless energy prices soar once again – which seems unlikely from current levels – global, and hence British, goods price inflation should fall sharply over the rest of 2023.
The worry though is that even if goods price inflation were to fall to zero, service price inflation at around 6% would keep headline inflation above the Bank’s 2% target.
The ultimate driver of services price inflation is the single biggest input cost across the service sector, which is wages. Understanding what is likely to happen with service price inflation means looking at developments in the jobs market.
source: SORBUS PARTNERS, Office for National Statistics (data as at: 01/05/23)
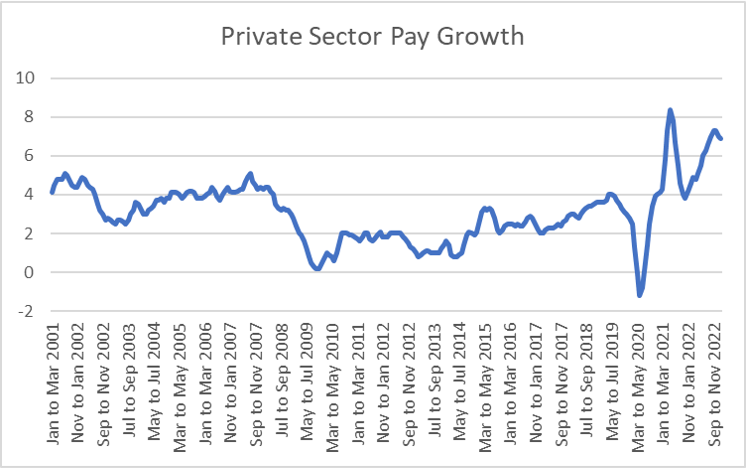
Private sector annual regular pay growth gives the cleanest signal on the tightness of the jobs market. Both the large drop in pay pressures immediately after the pandemic hit and the very rapid spike a year later should be put to one side. The ONS measures regular pay growth using a simple average, or mean, measure. That leaves the data open to what statisticians call compositional and base effects. Furloughing several million workers in 2020, most of whom saw their effective pay fall to 80% of its previous level, was enough to pull the average down sharply. The return of those workers sent it sharply higher. Neither of the moves says a great deal about the underlying situation.
Rather the picture, excluding those huge swings, is of a more gradual stepping up in pay pressures over the course of 2021 and 2022. That fits with the story of a hiring boom as the economy reopened in 2021 coupled with a serious shortage of workers driven by rising chronic sickness, early retirement and emigration. As private sector pay growth has headed to 6%, so too has service price inflation.
The rise does seem to have halted since the end of 2022 but it is too early to say if wage growth will head back to more normal levels in the months ahead.
With the economy slowing and the number of advertised job vacancies falling, there are definitely signs that wage pressures are abating. With firms and households yet to feel the full impact of the rise in interest rates over the past year, demand for labour is likely to fall further in the coming months. But unless labour picks up quickly, that may not be enough to bring the jobs market back into balance. The British labour supply situation looks increasingly acute compared to the situation in Europe and North America.
Whilst it seems highly likely that headline inflation, driven by global factors, will drop over the rest of the year, services inflation may well stay higher than either the Bank of England or the Treasury had anticipated just a few weeks ago. Given a more entrenched inflation problem, the Bank of England may well be forced to hold rates higher or longer than its peers.
|
WHAT WE ARE WATCHING 11th May, Bank of England – May is one of the four months a year in which the BOE sets out its economic projections. The inflation miss since the February projections will necessitate a re-evaluation. If the Bank is forced to materially revise up the expected path of CPI, then further rate hikes will follow. 18th May, British consumer confidence – As Spotlight has consistently highlighted, consumer confidence is the most reliable near term indicator for British growth. The impact of higher energy bills as government support is rolled back may lead to a further fall in consumer confidence. |