SORBUS spotlight: looking back on the big inflation
The latest inflation numbers from the Office for National Statistics disappointed both financial markets and Bank of England watchers. The annual rate of consumer price inflation fell to 2.3% in the year to April, whilst analysts had been hoping for a fall to 2.1%. That stickiness in price pressures pushed back hopes of the first rate cut from the Monetary Policy Committee coming as soon as the June meeting.
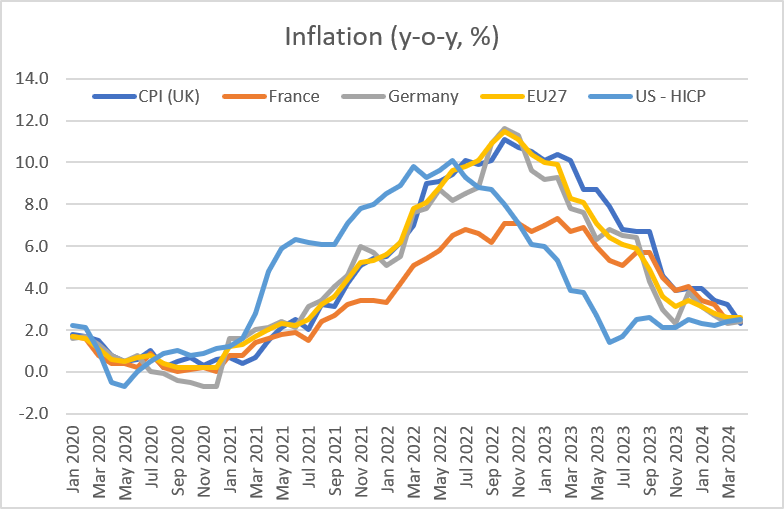
But, disappointments aside – and really quibbling over a fifth of a percentage point in a monthly and sometimes volatile number is at times almost a little silly – there was some good news in the latest data. It is not only the lowest UK inflation number since July 2021 but also represents the first time British inflation rates have been below those of the USA and Europe since mid-2022.
source: SORBUS PARTNERS, ONS (data as at: 23/05/2024)
The overall chart of inflation rates across Europe, Britain and the United States over the past few years gives an informative picture of three key facts.
Firstly, inflation rates in the western world have been unusually synchronised since 2020.
Global inflation spiked after the pandemic driven by an almost perfect storm of factors. Lockdowns across much of the globe not only severely disrupted global goods supply chains but also ushered in much higher-than-normal consumer demand for goods. In 2020 and early 2021 with many service businesses closed, the typical Western consumer spent a great deal more than normal on deliveries from the likes of Amazon and a great deal less in pubs and on haircuts than in prior years. To that was added a global spike in energy, and food prices which began in the summer of 2021 and was exacerbated by Russia’s invasion of Ukraine in 2022. Finally both fiscal and monetary policy were set to ultra-loose mode further stoking up demand at a time when inflation was already beginning to pick up.
The second thing that is clearly visible in the most straightforward of charts on headline price changes, is that the United States enjoyed a much faster pick-up in economic activity in 2021 than in its peers across the Atlantic. However the impact of the delayed response to inflation from central banks is that temporary factors (energy costs etc.) became wage inflation which is sticky; US inflation remains stubbornly higher than desired.
Thirdly though there is the uncomfortable fact that British inflation has been higher than that experienced in other advanced economies. That partially reflects sterling weakness in 2022 which magnified the level of imported price shocks, but most influentially that the BoE was further behind than even the Fed in raising interest rates.

source: SORBUS PARTNERS, ONS (data as at: 23/05/2024)
Looking at it another way, focussing on the overall change in the price level over the three years between March 2021 and March 2024 gives a clear steer.
In the course of just three years the price level in Britain jumped by more than 21%, in effect almost a decade of “normal” inflation was squeezed into just 36 months.
What is more, the nature of that inflation varied. It is instructive to look at the price level – i.e. what people actually paying on a month-by-month basis, rather than the usual measure of the annual rate of change – for two consumer staples: food and domestic energy.
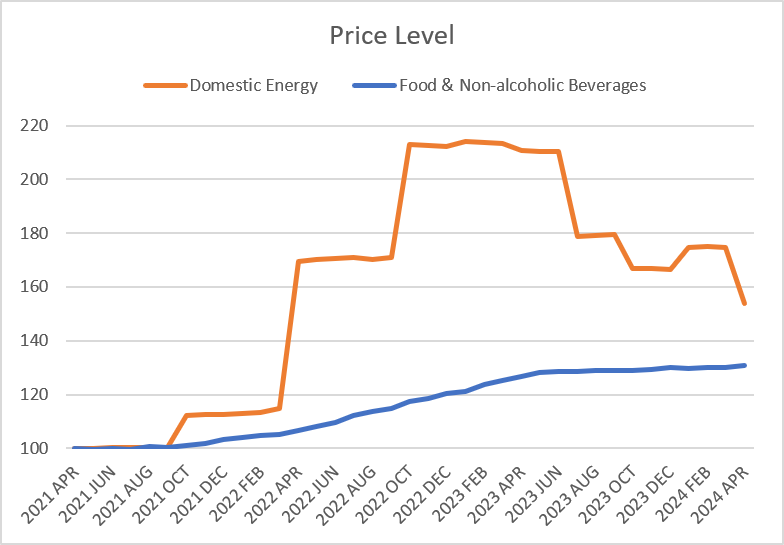
source: SORBUS PARTNERS, ONS (data as at: 23/05/2024)
Food prices have risen by 30% over the past three years, well ahead of the rate of wider inflation and – despite the dipping in the headline rate of price growth – show no signs of falling soon.
The story with energy, as most people are only too painfully aware, is even more dramatic. The functioning of the energy price cap gives an unusual shape to the numbers. The good news is that prices are actually falling relatively quickly. The bad news of course is that they are still more than 50% higher than in early 2021.
The distributional impact of the last three years has fallen uneasily across different types of household, although not necessarily in the way one expects.
Food and energy price inflation – which have seen the most spectacular rates of growth – are especially toxic. Because in many cases they are not goods which households have the option to substitute away from and, in general, the poorer a household is the greater the proportion of its income that gets swallowed up by them. All things being equal, a spike in inflation led by food and energy prices might be expected to hit lower income households harder. But things are rarely equal in practice.
Wage growth since 2021 has been especially strong at the bottom end of the jobs market, partially reflecting the two largest back to back increases in the minimum wage on record and partially reflecting the mismatch between labour supply and labour demand for unskilled and semi-skilled jobs which has pushed up wages in the sectors. The government has also, since 2020, sought to uprate benefits in line with inflation even whilst wider wage growth has lagged behind it.
The net result is that whilst almost all types of household have seen their living standards squeezed since 2021, the pain has been proportionately larger for middle and higher earning households – even before the impact of freezing tax allowances is considered.
The big picture remains grim.
source: SORBUS PARTNERS, ONS (data as at: 23/05/2024)
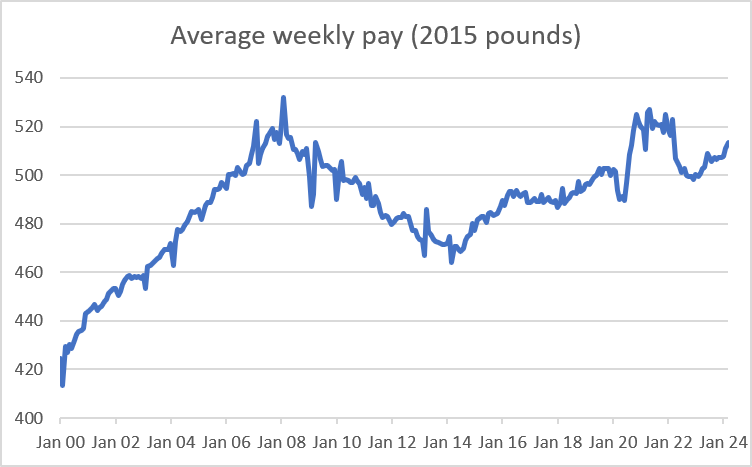
Real weekly earnings (measured in terms of average 2015 prices) have staged a weak recovery over the past year as headline rates of inflation have dipped but remain lower than their late 2021 levels. More worryingly of course, the intense squeeze of the early 2020s followed on the back of a decade of poor growth after the financial crisis of 2008.
A period of much higher than normal, and higher than expected, inflation was always likely to have hit household living standards but the usual upside would be a lower burden of government debt. In previous episodes of fast price rises – in the early 1990s, in the 1980s, in the 1970s and in the 1960s – the government has found some of its debt burden being inflated away. If the value of money GDP rises faster than the government’s borrowing, then the debt/GDP ratio should fall and higher inflation usually means a quicker pace of money GDP growth.
This time though the cloud of high inflation did not come with its usual silver lining.
Two factors explain this. For a start, a much greater proportion of UK government debt is now directly index-linked to inflation than in the past. Investors eventually wised up to the government’s use of inflation to erode their obligations and have insisted, in some cases, on safeguards. But more importantly, the government has actually intervened to try and cushion the economic blow facing households over the past three years. Benefit uprating has already been discussed but that pales in comparison to the impact of the energy price cap (whereby the government limited the hit to households but made good the difference to energy firms) or the furlough scheme of 2020-21.
Britain is emerging from the highest inflation period it has experienced in decades with damaged household balance sheets and a weaker set of public finances.
Whatever happens next to price growth, the worst is almost certainly in the past. The toxic cocktail of a global energy and food price spike, pandemic related supply chain disruption and ultra-loose macroeconomic policies is unlikely to be repeated anytime soon.
But it is far too early to say that the era of uncomfortably – even if not spectacularly high – inflation is over. The United States data is currently providing a timely reminder that higher than desired inflation can linger for a long time. Just six months ago, markets were prematurely celebrating inflation’s demise in the US and expecting three or even four rate cuts this year from the Federal Reserve. Few now expect that.
In reality the outlook for inflation is still uncertain. This is taking some getting used to for markets. In the decade after 2008, it was broadly safe to assume that inflation would be mostly low and that central banks would be able to telegraph the likely path of their policy well in advance. In the mid-1990s to mid-2000s before this inflation was also generally low and stable and central bank policy predictable.
Now though we are moving back to a world more like the 1960s to mid-1990s, one in which inflation still has a capacity to occasionally surprise and the central banks, if they are honest, have no real idea where interest rates will be in 18-24 months’ time. Adjusting to this new world will take time and no doubt bring much turbulence. But the sooner markets accept that central bankers are not all knowing oracles and that the future is fundamentally unknowable the better. Central bankers long talked about being “data dependent” and basing their next steps on the data as it comes in rather than on any sort of planned timetable. Investors increasingly acknowledge that the data signals are weak and that the conclusions drawn from them by central banks are often both wrong and stated with a confidence that should not be trusted.
|
What we are watching Beige Book, 29th May – The US Federal Reserve publishes its so-called Beige Book eight times a year. It consists of highlights of interviews conducted with key decision makers at large, medium and small firms across the US by the Fed’s agents. Whilst obviously anecdotal, in recent months the intelligence picked up on labour market conditions and price pressures has been a better guide to what is happening in the economy than many forecasts. US Jobs Market, 6th June – US inflation is unlikely to materially fall unless the jobs market continues to cool. Wage growth is the key measure to watch. Bank of England, 20th June – Whilst there is still a chance that the Bank might cut at its next meeting it seems more likely to wait until August when a new Monetary Policy Report, with up to date forecasts, will be published. Still, the tone of the minutes will be closely scrutinised. |