SORBUS spotlight: The US Outlook
The United States has been the standout growth story of the post-pandemic years. Perhaps the best way to measure this is to compare the size of national output at the end of 2023 to the level it was expected to be at by the end of 2023 in the last set of pre-covid IMF forecasts back in the winter of 2019. The world economy, as a whole, is around 3% smaller than it was expected to be. That may now not sound like much but 3% of total global output is a big number – the globe has essentially lost an entire year’s worth of normal economic growth as a result of the pandemic. The advanced economies have fared somewhat better, being only 2% below their expected level – much of the pain was concentrated in emerging economies and developing countries. In the United States though, economic output at the end of 2023 was around 0.5% higher than the International Monetary Fund expected four years earlier. That is extraordinary.
Whilst the US, like pretty much everywhere, endured a sharp fall in output in 2020 it bounced back rapidly in 2021 and 2022 and put in a decent performance in 2023. Understanding the US’s relative outperformance means grasping how its policy response to the pandemic differed from that of its peers.
The short version is: it was a lot bigger and more sustained. The Federal Reserve, like other central banks, slashed rates and re-upped its programme of quantitative easing. Unlike other central banks though, the Fed had been hiking since 2016 and had more space to cut going into the crisis than its European peers. The biggest difference though was on the fiscal side. The US moved quicker and faster than most comparable economies and was more than prepared to accept the resulting budget deficits and borrowing.
Importantly the nature of the US fiscal response varied from that found in Europe and the UK. Whereas European states generally moved to protect jobs – via things like the British furlough scheme or continental short-time working schemes – the Americans instead focussed on protecting incomes. Citizens received stimulus cheques straight from the government and unemployment benefits were temporarily boosted to levels in excess of the minimum wage. In effect, the idea was to let unemployment soar but provide temporary help to the unemployed.
On one level, one cannot argue with the results. No other major economy has managed to outgrow expectations despite a once in a century pandemic. On the other hand though, a clear case exists that the US erred on the side of too much stimulus. The incoming Biden administration, in January 2021, pressed ahead with its own plans for fiscal expansion – based on expanding welfare entitlements and upping infrastructure spending – despite signs that the economy was already over heating.
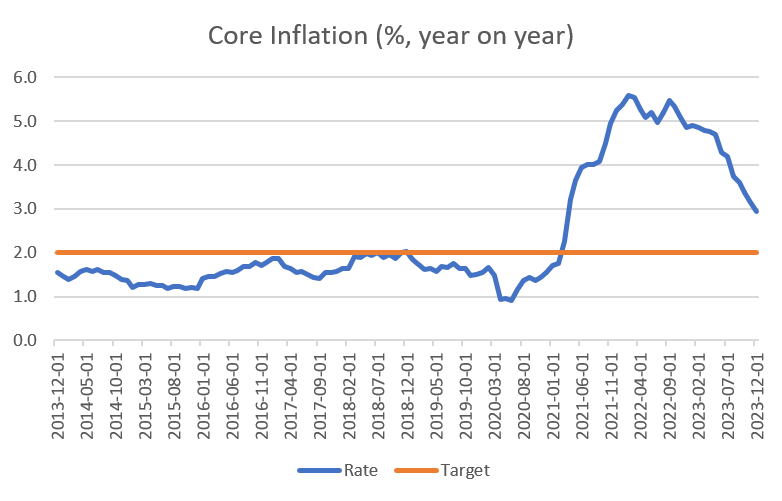
By 2021 it was clear that there was little spare capacity in the US economy and inflation took off.
source: SORBUS PARTNERS, Federal Reserve Economic Data (data as at: 20/02/2024)
The Fed’s preferred measure of inflation is the core rate of Personal Consumption Expenditures (PCE) inflation, excluding food and energy prices. In theory this measure strips out volatile, and globally set, energy and food prices and provides a cleaner rate on the state of domestic price pressures.
The broad story is that after a decade of inflation being if anything too weak, it took off in 2021 and continued to rise into 2022. The good news for policymakers is that 2023 saw a fairly rapid drop in this measure of price growth as tighter monetary policy began to bite.
Whilst British and European inflation in 2022 included, at least temporarily, a very strong energy price element, especially after Russia’s invasion of Ukraine, the US story was mostly one of tight domestic jobs markets.
Understanding the US job’s market has been key to understanding its inflation dynamics.
source: SORBUS PARTNERS, Federal Reserve Economic Data (data as at: 20/02/2024)
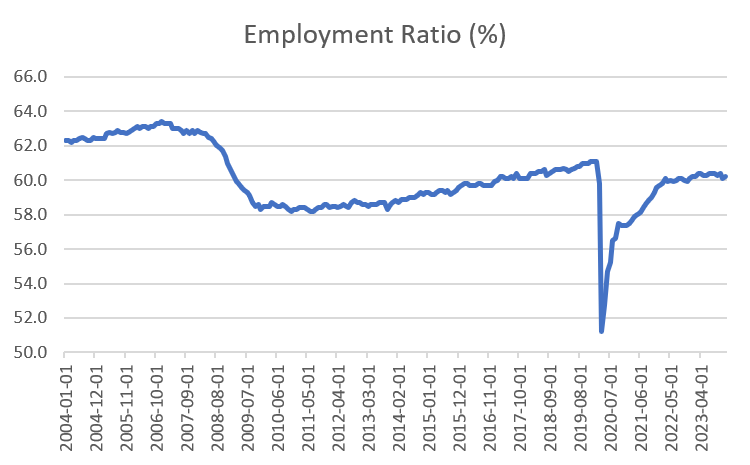
The employment ratio, the percentage of the 16-64 year old population in work, is the easiest way to see the big picture.
The 2008-09 recession took a toll on the number of Americans in work and the post-recession recovery was long, slow and incomplete. Even in 2019 the employment ratio was off its 2008 highs. It was the nature of that slow jobs recovery which contributed to a decade of under-target inflation – the jobs market was simply too loose to generate the kind of wage growth consistent with even 2% inflation, let alone above target price growth.
The collapse in employment in early to mid 2020 was the fastest experienced by any major economy and the most rapid pace of job losses the US had seen since the depression of the 1930s. But unlike in the 1930s, the income of the newly unemployed was protected and, in many cases, actually higher than when they had been in work.
The recovery in employment levels, as pandemic restrictions were eased, was initially incredibly rapid before petering off to a slower – but still faster than 2009-2019 – rate in 2021 and early 2022. Worryingly it now appears to have plateaued at a lower than pre-pandemic level.
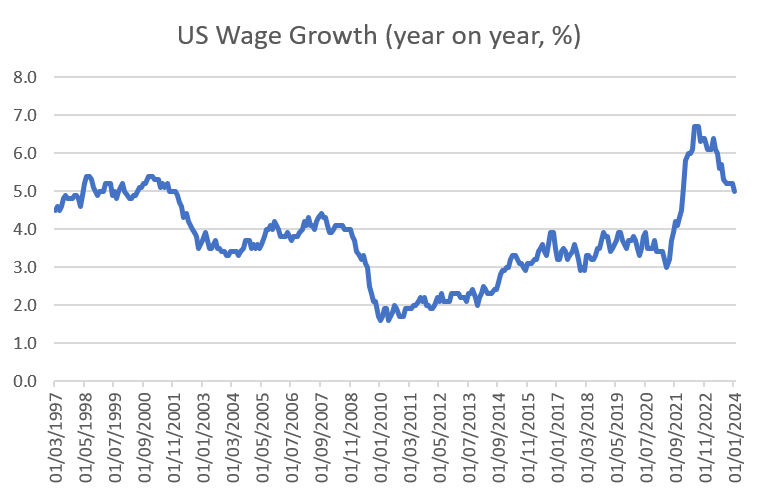
These broad job market trends have been mirrored in the pattern of wage growth.
source: SORBUS PARTNERS, Federal Reserve Bank of Atlanta (data as at: 20/02/2024)
The weak wage growth of the post-financial crisis years gave way to a surge in labour costs amid a hiring boom in 2021 – complicated by extended unemployment benefits lowering the attractiveness of returning to work for many.
Wage growth has come off the boil over the last year but remains higher than the Fed is comfortable with. The employment rate stabilising at a level below its pre-pandemic size, despite economic output now being higher, suggests there is little in the way of spare capacity in the United States. That may imply wage growth eventually settling at a higher level than the 2009-2019 norm.
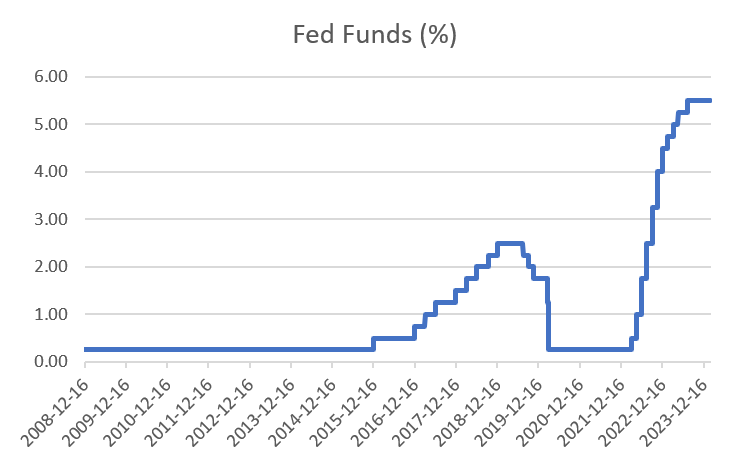
The US monetary policy response, which was perhaps a tad late, was eventually decisive.
source: SORBUS PARTNERS, Federal Reserve Economic Data (data as at: 20/02/2024)
Whilst the previous hiking cycle, between 2016 and 2019, was slow and measured the 2021-2023 hikes were the fastest in several decades. The Fed was clearly spooked by the pick up in inflation and perhaps unnerved by its colossal error in understanding its contribution towards the spike and in its failure to identify it.
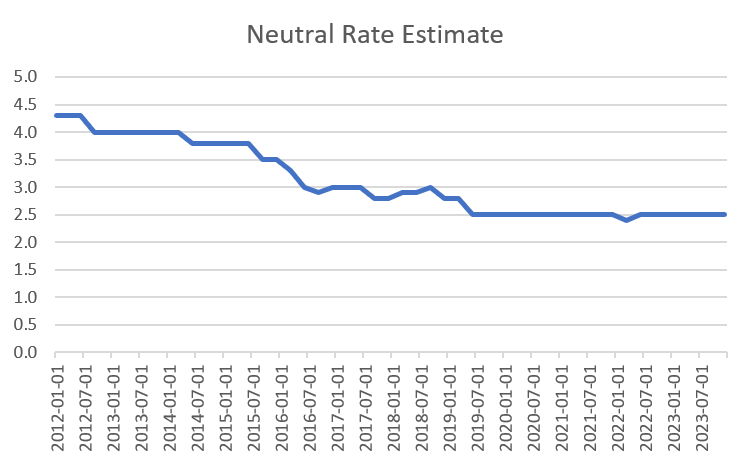
Judging how tight monetary policy is, is never straight forward. Since 2012 the Fed has made the job somewhat easier by publishing, at quarterly intervals, the median estimate of the members of the rate-setting Federal Open Market Committee (FOMC)’s views of the likely long-run level of Fed funds rates. In effect this is a chart of what a ‘normal’ or neutral rate of interest would look like – the level at which rates are neither adding stimulus to the economy nor holding it back.
source: SORBUS PARTNERS, Federal Reserve Economic Data (data as at: 20/02/2024)
The striking thing about this picture is how the view of the neutral rate has fallen over time. Back in 2012 the Fed thought that rates somewhere about 4% were “normal” but as the decade of low inflation and weaker wage growth wore on that view was gradually revised down to just 2.5% by 2019. Equally strikingly neither the pandemic nor the recovery has done much to change that view.
The reasons for this fall in neutral rates have been discussed by Spotlight in the past. They are many and varied. Demographic change with an ageing population has muted inflationary pressures, higher debt levels at the government, corporate and household level have meant that any level of interest rates bites harder and a more unequal distribution of wealth has crimped the spending power of lower income households. Taken together they all suggest rates are likely to be lower in the decades ahead than in the decades behind.
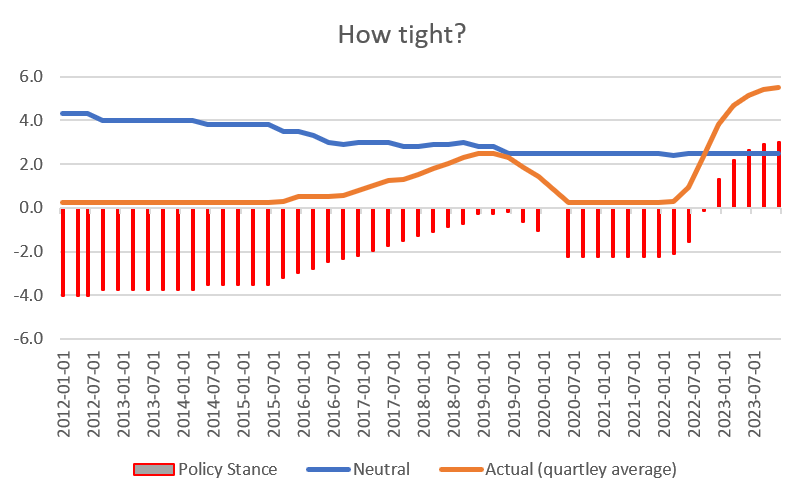
Putting the two charts together – the actual level of Fed Funds and the FOMC’s views on the neutral rate – allows us to get a sense of how tight the FED thinks its own policy is.
source: SORBUS PARTNERS, Federal Reserve Economic Data (data as at: 20/02/2024)
A combination of rising policy rates and falling views on the neutral rate meant that by the eve of the pandemic the Fed thought that policy was broadly neutral after a decade of stimulus. The cuts in 2020 moved policy to a loose setting and the Fed now thinks that the hiking cycle, which concluded in August last year, has left policy rather tight.
Perhaps the key takeaway is that as inflation falls the room is certainly there for the Fed to cut. Just going back to neutral would involve rates falling back towards 2.5%.
The Fed though is keen to signal that whilst cuts are now much more likely then further hikes, they will not be immediate. US inflation remains above target and wage growth, whilst weaker than in 2023, is still at a level inconsistent with the Fed’s price target.
Higher than expected inflation numbers in February have seen markets move to reduce the odds of the first cut coming in March. That seems right. The safest course is to not expect any further US hikes – policy is already tight and inflation is falling, but not expect rapid cuts either.
|
What we are watching US, PCE Inflation, 29th February: Markets often pay too much attention to US CPI inflation – which is directly comparable to the European and British numbers – and not enough to PCE. Personal Consumption Expenditure inflation is the Federal Reserve’s preferred measure. China Manufacturing PMI, 1st March: The Purchasing managers’ index – a barometer of the opinion of firms – is the cleanest and most timely way to judge the state of Chinese manufacturing, which is set at the heart of global goods value chains. Last month it fell to 49, with any reading below 50 signalling contraction. Analysts expect further falls in the new data. Fed Meeting, 20th March: Whilst the Fed is unlikely to cut at its March meeting their tone will be closely watched. One thing to watch for is any change in the FOMC’s estimate of median long term neutral rates. |