SORBUS spotlight: The UK. Looking back and looking ahead.
It says something rather telling about the state of an economy when GDP revisions, part and parcel of the process of compiling economic data, are treated as big news. That however was the case in September last year when the Office for National Statistics (ONS) unveiled its revised view of the path of the British economy since the pandemic.
Producing reliable economic data is a time-consuming business. There is a trade-off between timeliness and accuracy: the stuff which becomes available quickly is rarely the most useful. Alan Greenspan, an ex-head of the US Federal Reserve, once compared tracking macroeconomic data to watching an old-fashioned polaroid photograph develop; it only comes into focus slowly with the picture gradually revealing itself. In the era of smartphones and instant image captures, this is a frustrating quirk.
The ONS, like other national statistics bodies, produces the first estimates of GDP around 6 weeks after the end of the quarter based on administrative data about tax receipts and welfare rolls together with surveys of firms and workers. As more data becomes available those initial estimates are updated in subsequent months and years.
Until September, the UK looked like a global outlier. Whilst the other six members of the G7 group of leading economies had all surpassed their pre-pandemic peaks – some by quite some way – the UK was, on that vintage of the numbers, stuck with an economy still smaller than it had been at the end of 2019. It was in a clear bottom place of the league tables. The revisions carried out in September rewrote recent economic history.
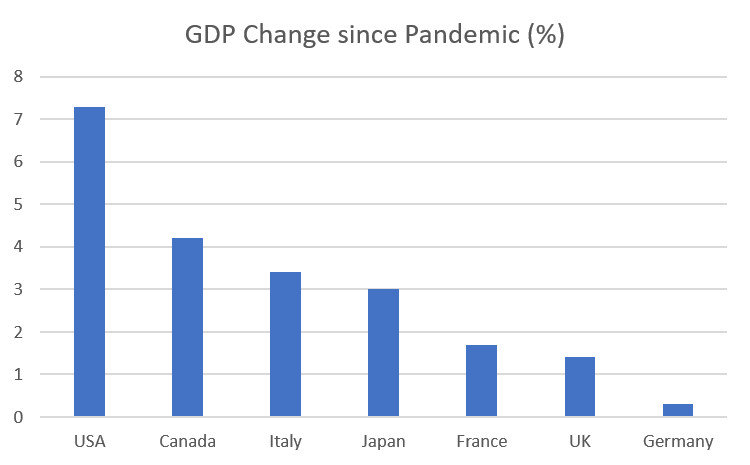
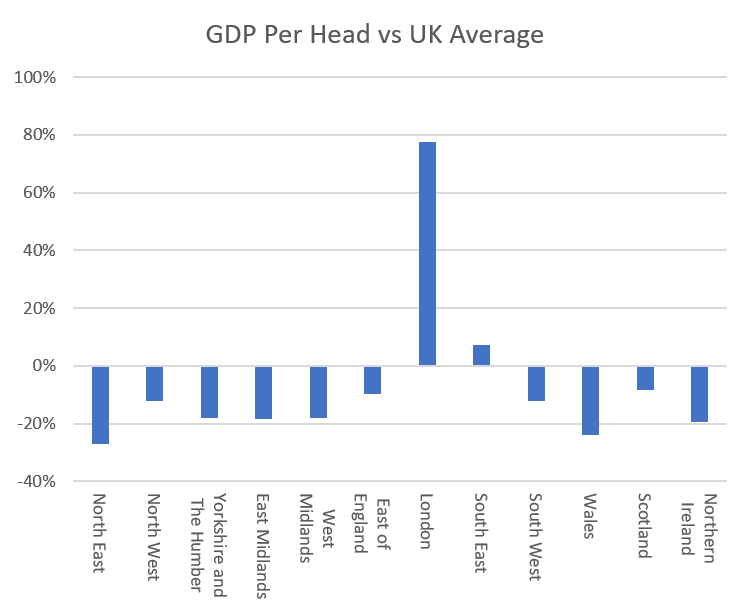
source: SORBUS PARTNERS, Commons Library Jan 2024 research briefing (data as at 05/01/2024)
Armed with better survey data from firms – especially on inventory levels and profit margins – the ONS revised down the size of the economic blow in 2020 and upped their estimate of the pace of the recovery in 2021.
Whilst this was all good news, the cheering was overdone. As a look at the chart above reveals, the UK’s recent performance was in fact from ‘abysmal’ to merely ‘poor’. 2nd from bottom is better than bottom but hardly a rousing performance.
The bigger problems though date back to well before the pandemic.
Paul Krugman, a Nobel prize winning economist, is fond of saying that ‘productivity is not everything, but in the long run it is almost everything’. Ultimately, he is correct. Whilst inflation and unemployment are the immediate economic issues that people feel day to day and tend to grab the media headlines and dominate political debate, productivity growth is the real driver of long-run economic performance. Effectively an economy can grow in one of two ways – it can add more workers to produce more output or it can find ways to make better use of existing workers and get more outputs from the same level of inputs. Only in the latter way can output per head, the crucial measure of incomes and spending power, grow in a sustainable way. It is rising productivity that underpins rising living standards and creates economic growth that actually feels like economic growth. It is also rising productivity that ultimately underpins corporate profit growth in the longer run.
Britain has a productivity problem. On one level the whole global economy has a productivity problem with the growth rate of output per hour worked – regarded as the key measure – having slipped noticeably in both advanced and emerging markets since 2008. But Britain’s problem is especially acute.
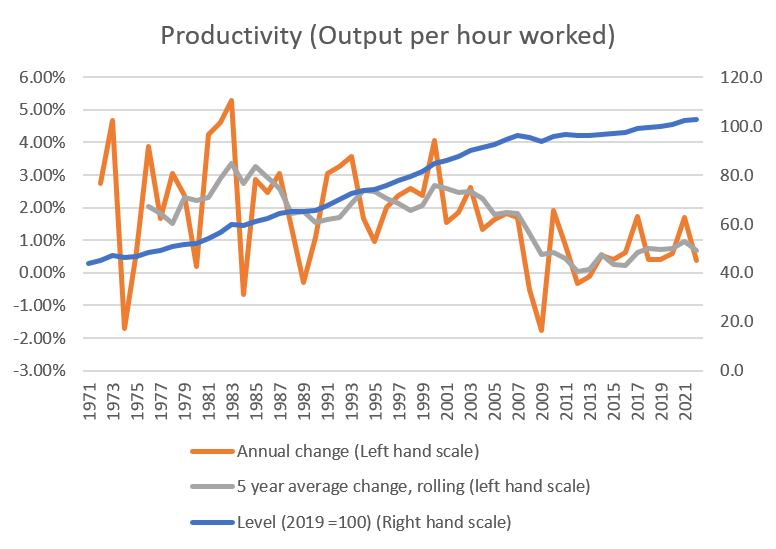
source: SORBUS PARTNERS, ONS (data as at: 22/01/2024)
The growth rate of productivity – which had been around 2-2.5% per year for decades before the financial crisis – slumped after 2008. The level of productivity has been essentially almost flat for the better part of 15 years.
Economists have taken to describing this as the ‘productivity puzzle’, which is an alliterative way of saying the reasons are still mostly unclear. Various explanations have been offered over the last decade but none has offered a complete solution.
What is clearer is the consequences of the productivity growth collapse.
It is most obvious when it comes to British wages.
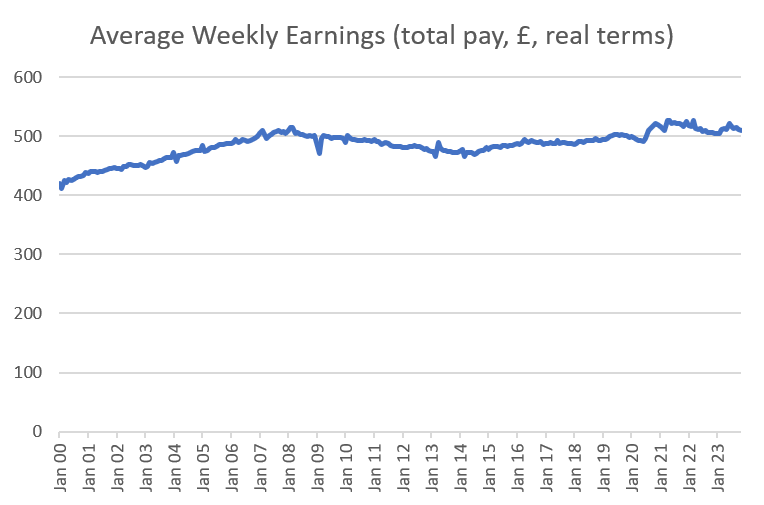
source: SORBUS PARTNERS, ONS (data as at: 22/01/2024)
Real wages, adjusted for changes in the price level, have suffered over the last 15 years. The actual real level of weekly pay is currently lower than it was in 2007 and not expected to recoup those heights until around 2027. Not since the early 1800s has Britain experienced two decades of stagnating real pay.
Whilst the sharp rise in inflation since 2021 has prompted talk of an immediate ‘cost-of-living crisis’ the reality has been a slow burning problem going back well over a decade.
It is the weakness of productivity growth that has underpinned the weakness of wage growth. In the years before 2008 it was regarded as perfectly normal for wages to rise by around 4-4.5% a year, inflation to be around 2% and productivity growth to be between 2.5% and 3%. The end result was real wage growth of around 2% and profit growth of 1-1.5% each year. In a world where productivity growth is absent though, real wage gains come at the expense of profits. With margins already squeezed in many sectors, the space to absorb such giveaways simply does not exist.
One factor sitting behind the poor performance of recent years is no doubt to be found in investment. Total investment levels – public and private – are unusually low in the UK, compared to its international peers.
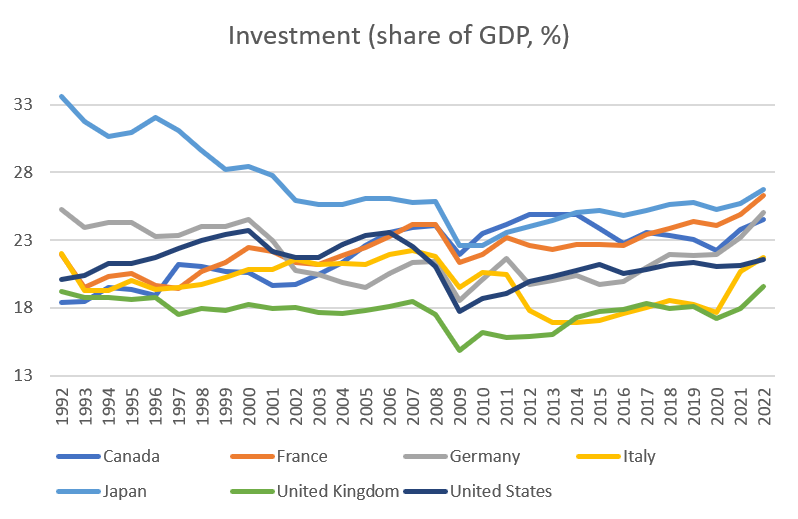
source: SORBUS PARTNER, IMF (data as at: 22/01/2024)
Expressed as a percentage of GDP, British investment has persistently been either the lowest or close to the lowest in the G7. That weakness can be found in both the public and private sectors. In the public, British governments of all parties have usually found capital spending the easiest cut to make when trying to balance their own books. Cancelling planned future investments tends to have lower political fallout than either raising taxes or immediate cuts in public services.
British business too though has tended to be investment-light. That partially reflects the make-up of Britain’s economy, with a much larger service sector (which tends to be less asset-intensive than manufacturing) compared to some other advanced economies. But even if one adjusts for the sectoral mix, the gap remains. British manufacturers, for example, tend to run with lower capital spending than their international peers in the same industry.
One explanation can perhaps be found in how different labour markets operate. British workers tend to be both cheaper and easier to get rid of than their overseas equivalents in other advanced economies. Given the choice between cheap, easy to hire and lower productivity workers or investing in expensive machinery that may well come with large sunk costs, many British firms have chosen to go down the labour-heavy, lower-productivity business model route. One example can be seen in supermarkets – in most British grocers, prices are generally still changed by hand. In France, by contrast, they tend to use automated digital displays.
Whatever the reasons for the investment gap, as long as it remains the productivity gap is unlikely to narrow in a sustainable manner.
The UK’s productivity woes may be equally related to its unusual economic geography.
source: SORBUS PARTNERS, ONS (data as at: 22/01/2024)
The level of GDP, income and productivity varies enormously across the United Kingdom. Indeed there is almost no such thing as an economically average place in Britain. GDP per head in the south east of England is roughly inline with the national average but that is about it. In London it is almost 80% higher and everywhere else, varying degrees of much lower.
The extent of these geographic economic differences is without precedent in any other advanced economy. Even in Italy, with its famous north-south divide, the level of GDP variation is less extreme. Almost staggeringly, the east-west divide in Germany is now narrower than that found in Britain.
Macroeconomists tend to talk in terms of national economies and use average figures but in the case of Britain this can be seriously misleading. On the average, conventional level, Britain looks similar to France or Germany and broadly in line with the northern European norm. But on a regional level Britain has one super-productive corner more comparable to Singapore sitting amid economies that appear more southern European than northern.
The above is the necessary context to understanding the British economic outlook going into 2024. The debate on whether or not the country will experience a technical recession or whether inflation will end the year closer to 2% than 5% will no doubt suck up much of the media and political attention in an election year. But the longer running problems of weak productivity, low investment and vast regional disparities sit at the heart of the economy’s real problems.
|
What we are watching 1st February, Bank of England: After 14 consecutive hikes the Bank of England finally paused last Autumn. Since the last meeting of the Monetary Policy Committee the news flow on inflation has been a little better but the MPC remains wary of market chatter of relatively rapid rate cuts. The MPC are likely to attempt to steer market expectations away from early cuts whilst keeping their options open and remaining dependent on the incoming flow of data. Expressing this will be a tough job. 2nd February, US Job Data: The pace of US wage growth and the overall tightness of the American jobs market remains the most important determining factor in the path of US interest rates. Spotlight will turn to the United States next month for a deeper dive. 6th February, British retail sales: British retailers had a tough November. And early reports suggest a difficult Christmas trading season too. The latest update from the British Retail Consortium should give a clearer picture. |