SORBUS spotlight: the demographic future
Once upon a time, much of what was then known as ‘political economy’ and nowadays is called ‘economics’ concerned itself with questions of population size and growth rates. Demographic factors were seen as one of the key determinants of whether or not a country was likely to succeed. One of the first great modern works of economics was that of the reverend Thomas Malthus. His catchily-entitled ‘An ‘Essay on the Principle of Population’ was published in 1798 and argued that there was an inverse relationship between the level of the population and the level of income per head. He argued that whilst the growth in available resources in an economy tended to move in a linear fashion (1,2,3,4, etc) the tendency of the population was to growth by what he called a ‘geometric’ – and modern mathematicians would dub an exponential – function (1,2,4,8, etc). By this grim calculus he reckoned that the natural tendency of humanity was to outgrow the resources available to sustain the population. In his model the result would be rising famine that would eventually force the population back into line with the resources available to maintain it. Broadly put, economic historians tend to think that Reverend Malthus was indeed correct. In the world before the nineteenth century, the economy was indeed Malthusian and periods of a population boom tended to lower GDP per head and eventually force fertility rates to fall. But by a great historical irony Multhus published his work just as the world was changing. The industrial revolution, the upsurge in productivity that accompanied it and the start of the global transition to modern economic growth allowed country after country to throw off the Malthusian shackles. If resources could also grow in an exponential manner then both population and GDP per head could grow at the same time.
Economists tend not to think much about demographics nowadays. Which is a shame because whilst the world may no longer be Malthusan, they still play a large role in growth, interest rates and ultimately investment returns. Demographics are not destiny but they are important.
A stylised history of the Western economies over the past six decades would run something like this: after the turbulence and high inflation of the 1970s, the 1980s onwards saw a return to economic stability. In the 1990s and 2000s inflation was low and stable, growth was decent and interest rates low. The last few years – after the pandemic – have seen interest rates once more on the rise and the return of volatile and high inflation.
Various explanations have been offered for the apparent stability of the 1990s and 2000s. Mervyn King, an ex-governor of the Bank of England, went as far as to describe the period from 1997 to 2007 as the NICE decade, with nice in this case standing for non-inflationary-continuous–expansion. The story of Mr King, and one popular with central bankers at the time, was that the better outcomes represented better policy-making. Independent central banks, freed from the constraints of their political masters, had tamed the business cycle through their control of interest rates.
Others have pointed to the changes in Western labour markets in the 1980s under Margaret Thatcher in Britain and Ronald Reagon in the United States which saw the power of organised labour broken and a great liberalisation in hiring and firing practices. Perhaps more flexible jobs markets explain the lack of price pressure? Others point to the intense period of globalisation that began in the 1990s.
A few have pointed out that sitting behind all of this, is a striking demographic change.
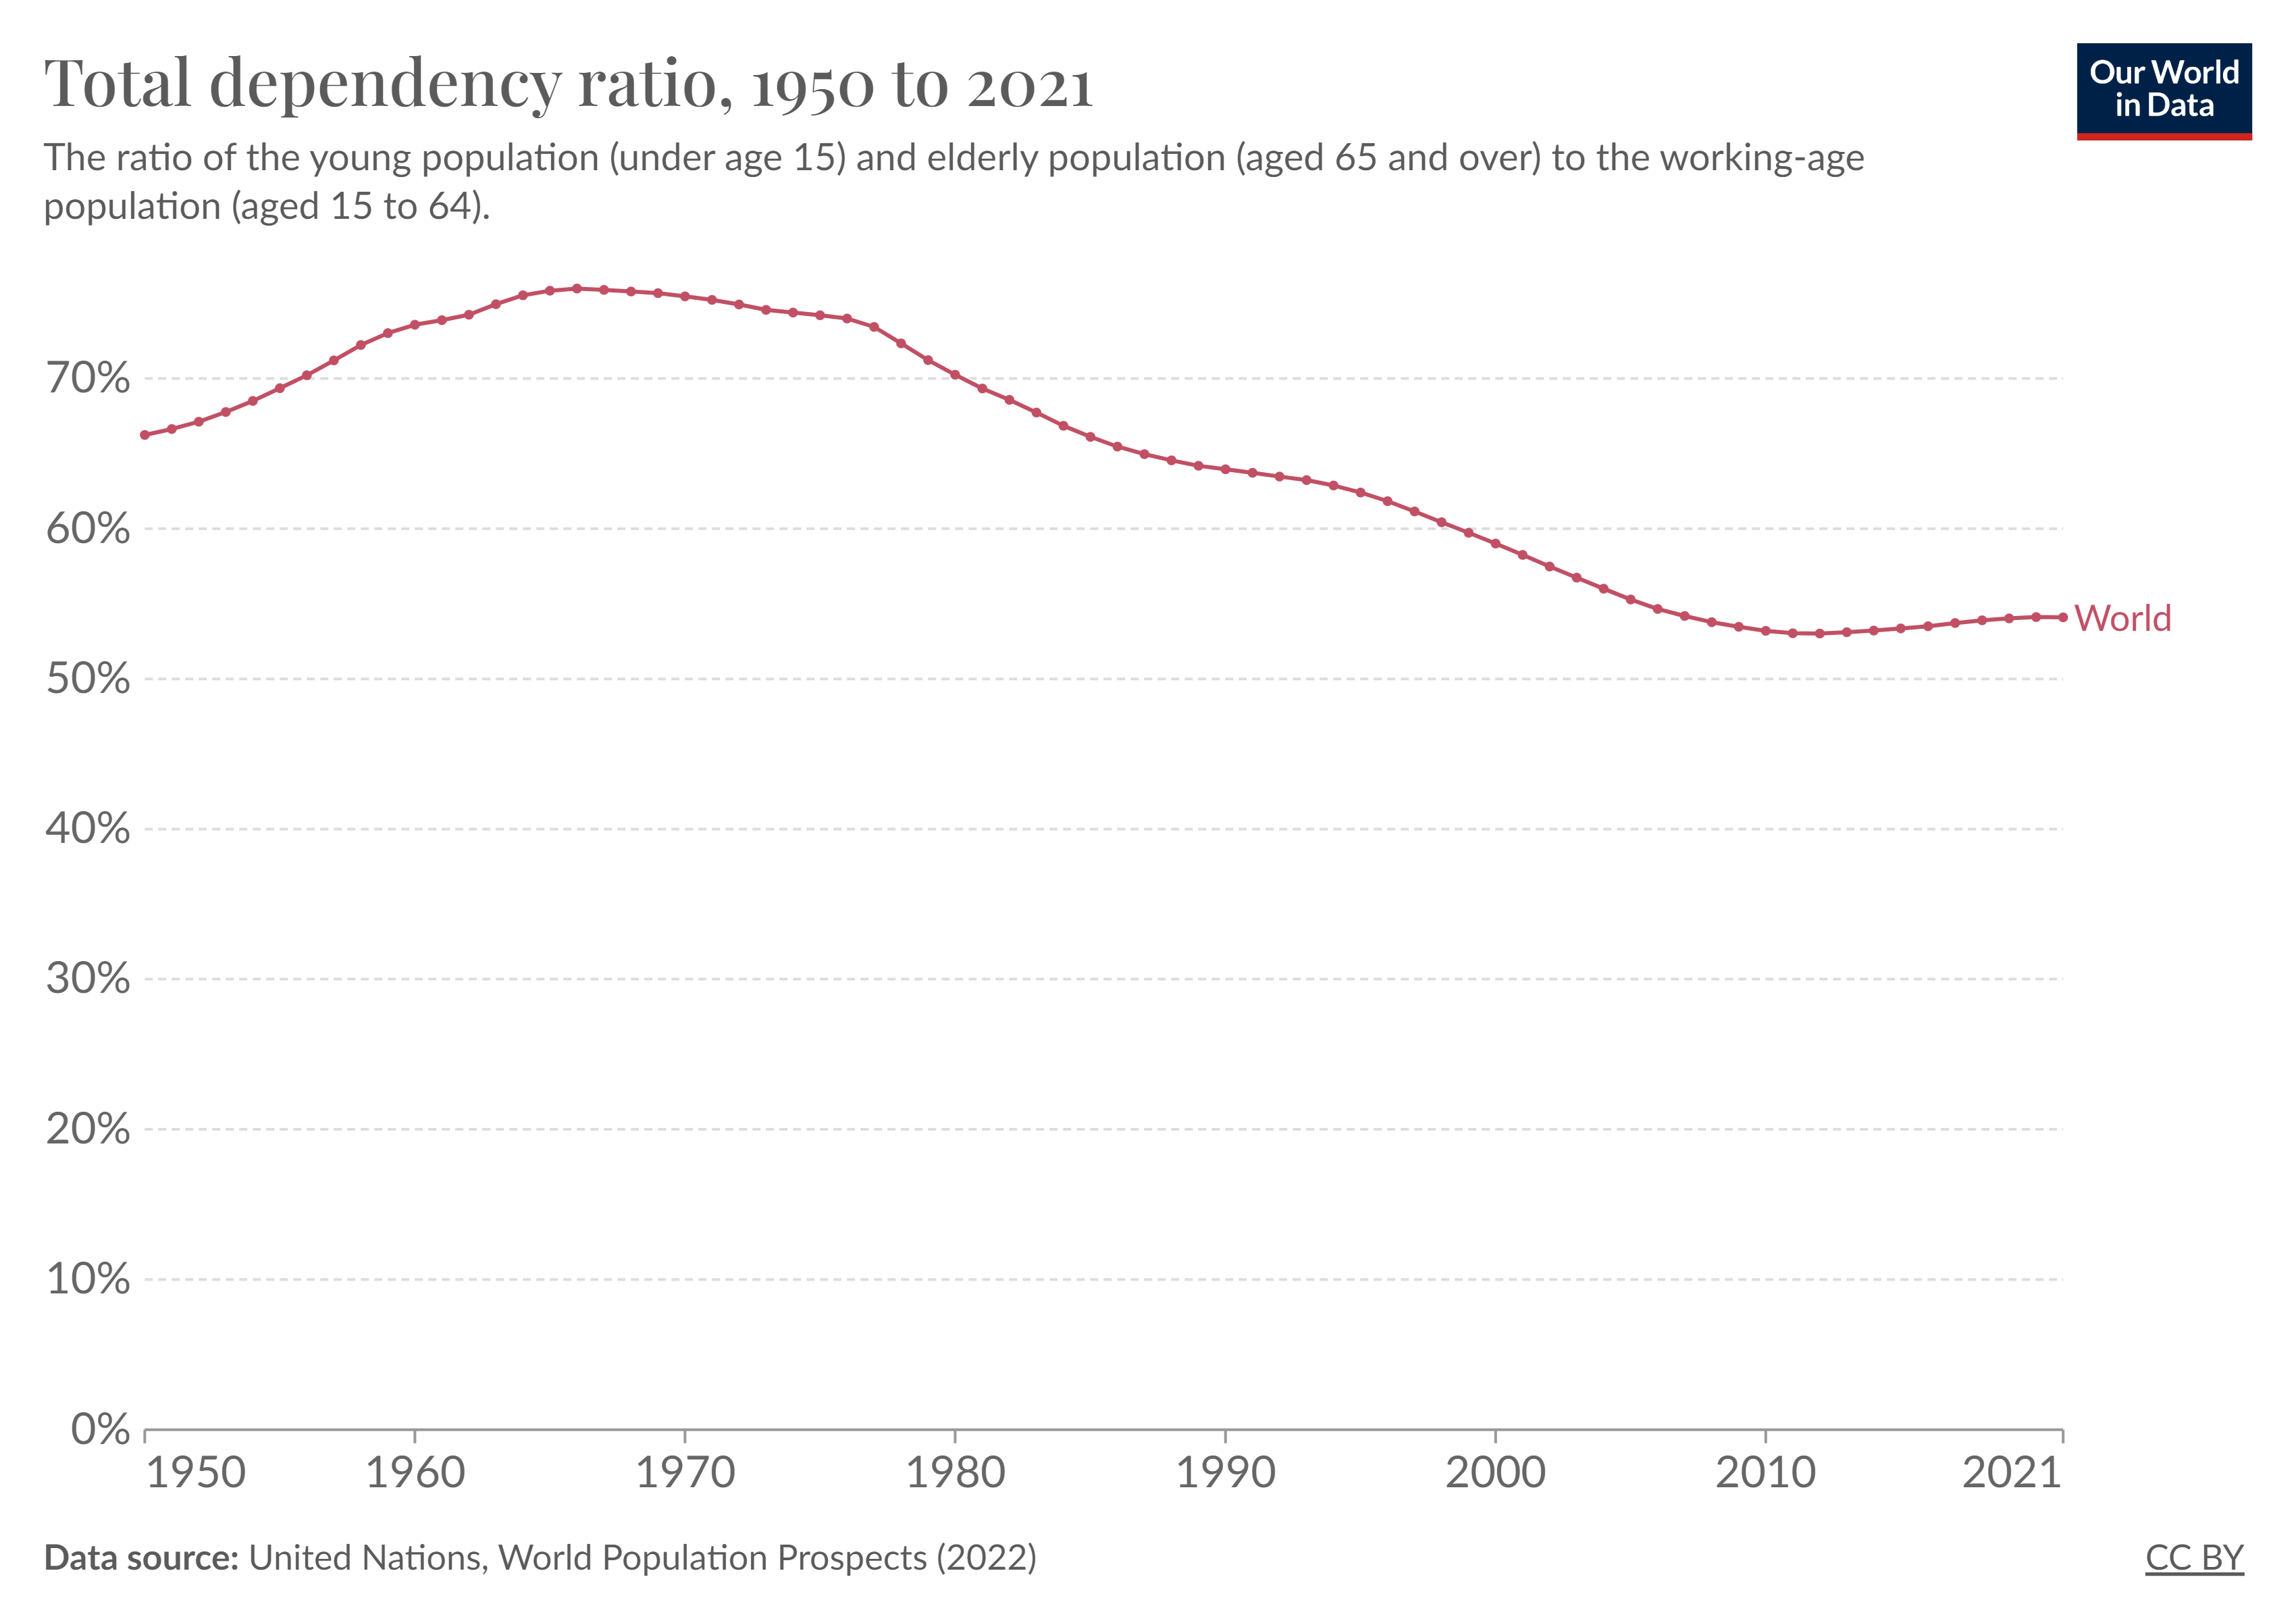
The global dependency ratio may be the most important ratio in economics that many economists have never considered.
data as at: 20/11/2023
It shows, expressed as a percentage, the ratio of working age people (defined as between 15 and 64) compared to children and older global citizens. If it is falling, the percentage of global people of working age, relative to the young and old, is rising. If it is rising then there are proportionally more retired people or children about.
From the late 1970s until circa 2010 it fell sharply from around 75% to just over 50%. That is to say in 1979, for every person aged 15 to 64 on the planet there were about 0.75 people aged over 65 or under 15. By 2010 for every working age person there were just over 0.5 people outside of 15-64.
According to some economists, this expansion of the relative size of the working age population over several decades was the single most important factor in driving global inflation lower and in explaining lower interest rates.
Start with inflation. As each cohort of children entered the global labour force between the late 1970s and 2010, the odds were that their cohort was larger than the one before. The pool of workers available to form was ever expanding and, all things being equal, a higher supply of something should lower its price. One reason for muted wage growth – in aggregate – over the 1980s, 1990s and 2000s – could simply be an expanding workforce. And that lower wage growth would help keep the lid on inflation.
Lower inflation feeds directly through to lower interest rates – and hence ultimately asset returns – but demographics may have given this trend an additional impetus. The seemingly ever growing workforce, coupled with muted wage pressures, may well have discouraged corporate investment in new equipment. There is little need to invest in labour saving technology if labour is plentiful and cheap. Lower corporate investment in the 1980s-2000s- certainly compared to the 1950s-1970s – reduced corporate demand for finance and also may have helped interest rates to fall.
The striking thing is that the dependency ratio stopped falling a decade ago and has begun to drift up. A powerful driver of lower inflation and lower interest rates that lasted for more than four decades has been removed.
In the view of some, the result will be higher interest rates and inflation in the decades ahead than in those just passed.
The best counter argument to this theory is the example of Japan. Japan, with rising longevity and a low birth rate, has been the world leader in demographic transitions.

data as at: 20/11/2023
And yet Japan has not seen rising inflation and higher interest rates over the course of the 1990s and 2000s but the exact opposite – deflation and rock bottom rates. Three important counterpoints exist though. Firstly, the trend within one country can be overcome by the wider global picture. Japanese firms were able to counteract domestic trends by taking advantage of the global glut of workers. Secondly, the headline figures miss important nuances. Take female jobs market participation as an example – in Japan it has risen from around 50% in 1990 to more like 55% today (source: Statista, data as at: 20/11/2023). But most importantly – geography and geopolitics may have outweighed raw demographics in the Japanese case. The country’s firms were able to take advantage of China’s entry into the global economy on a much larger scale than their American or European peers.
Even if the grander claims of the demographic theory of interest rates and inflation are overstated, one would be well advised to keep a close eye on demographic trends.
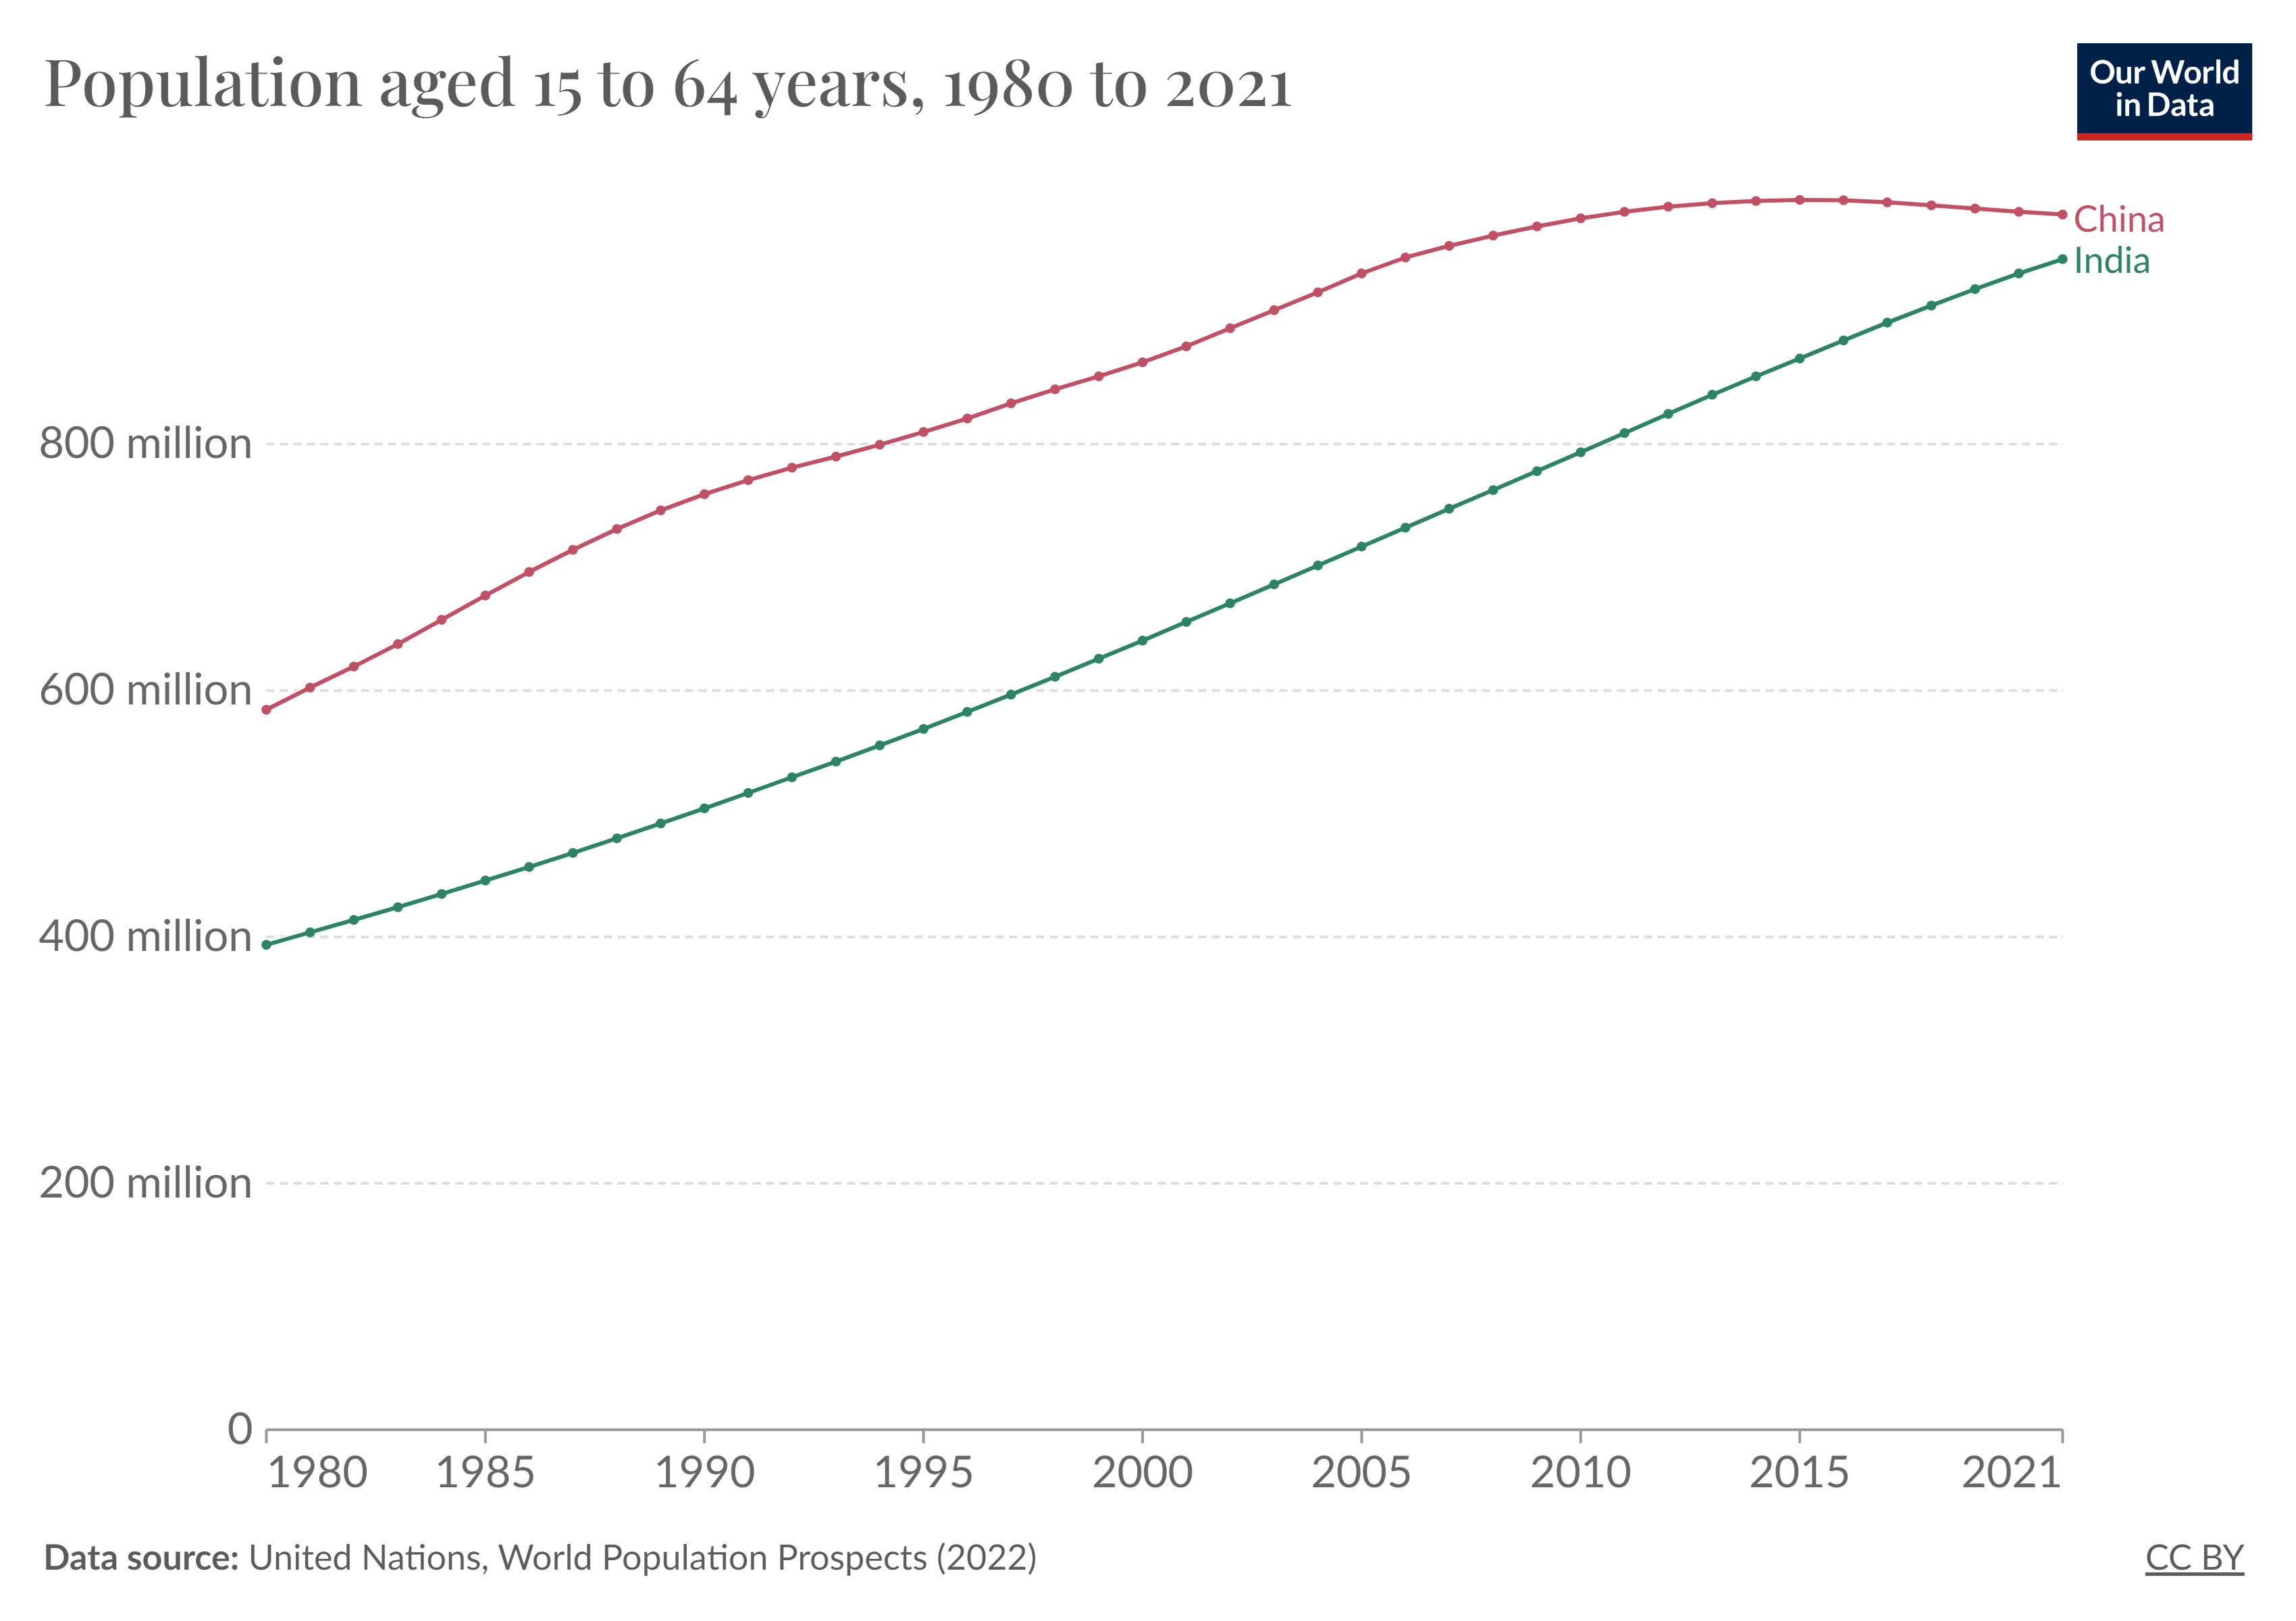
Take for example the number of working age workers in India and China as an example.
data as at: 20/11/2023
Back in 1980, there were around 50% more potential workers in China than India. Even a decade ago China possessed almost one billion people of working age compared to fewer than 850 million in India. But now the totals have almost aligned. Lower Chinese birth rates have finally started to drag the working age population rate down.
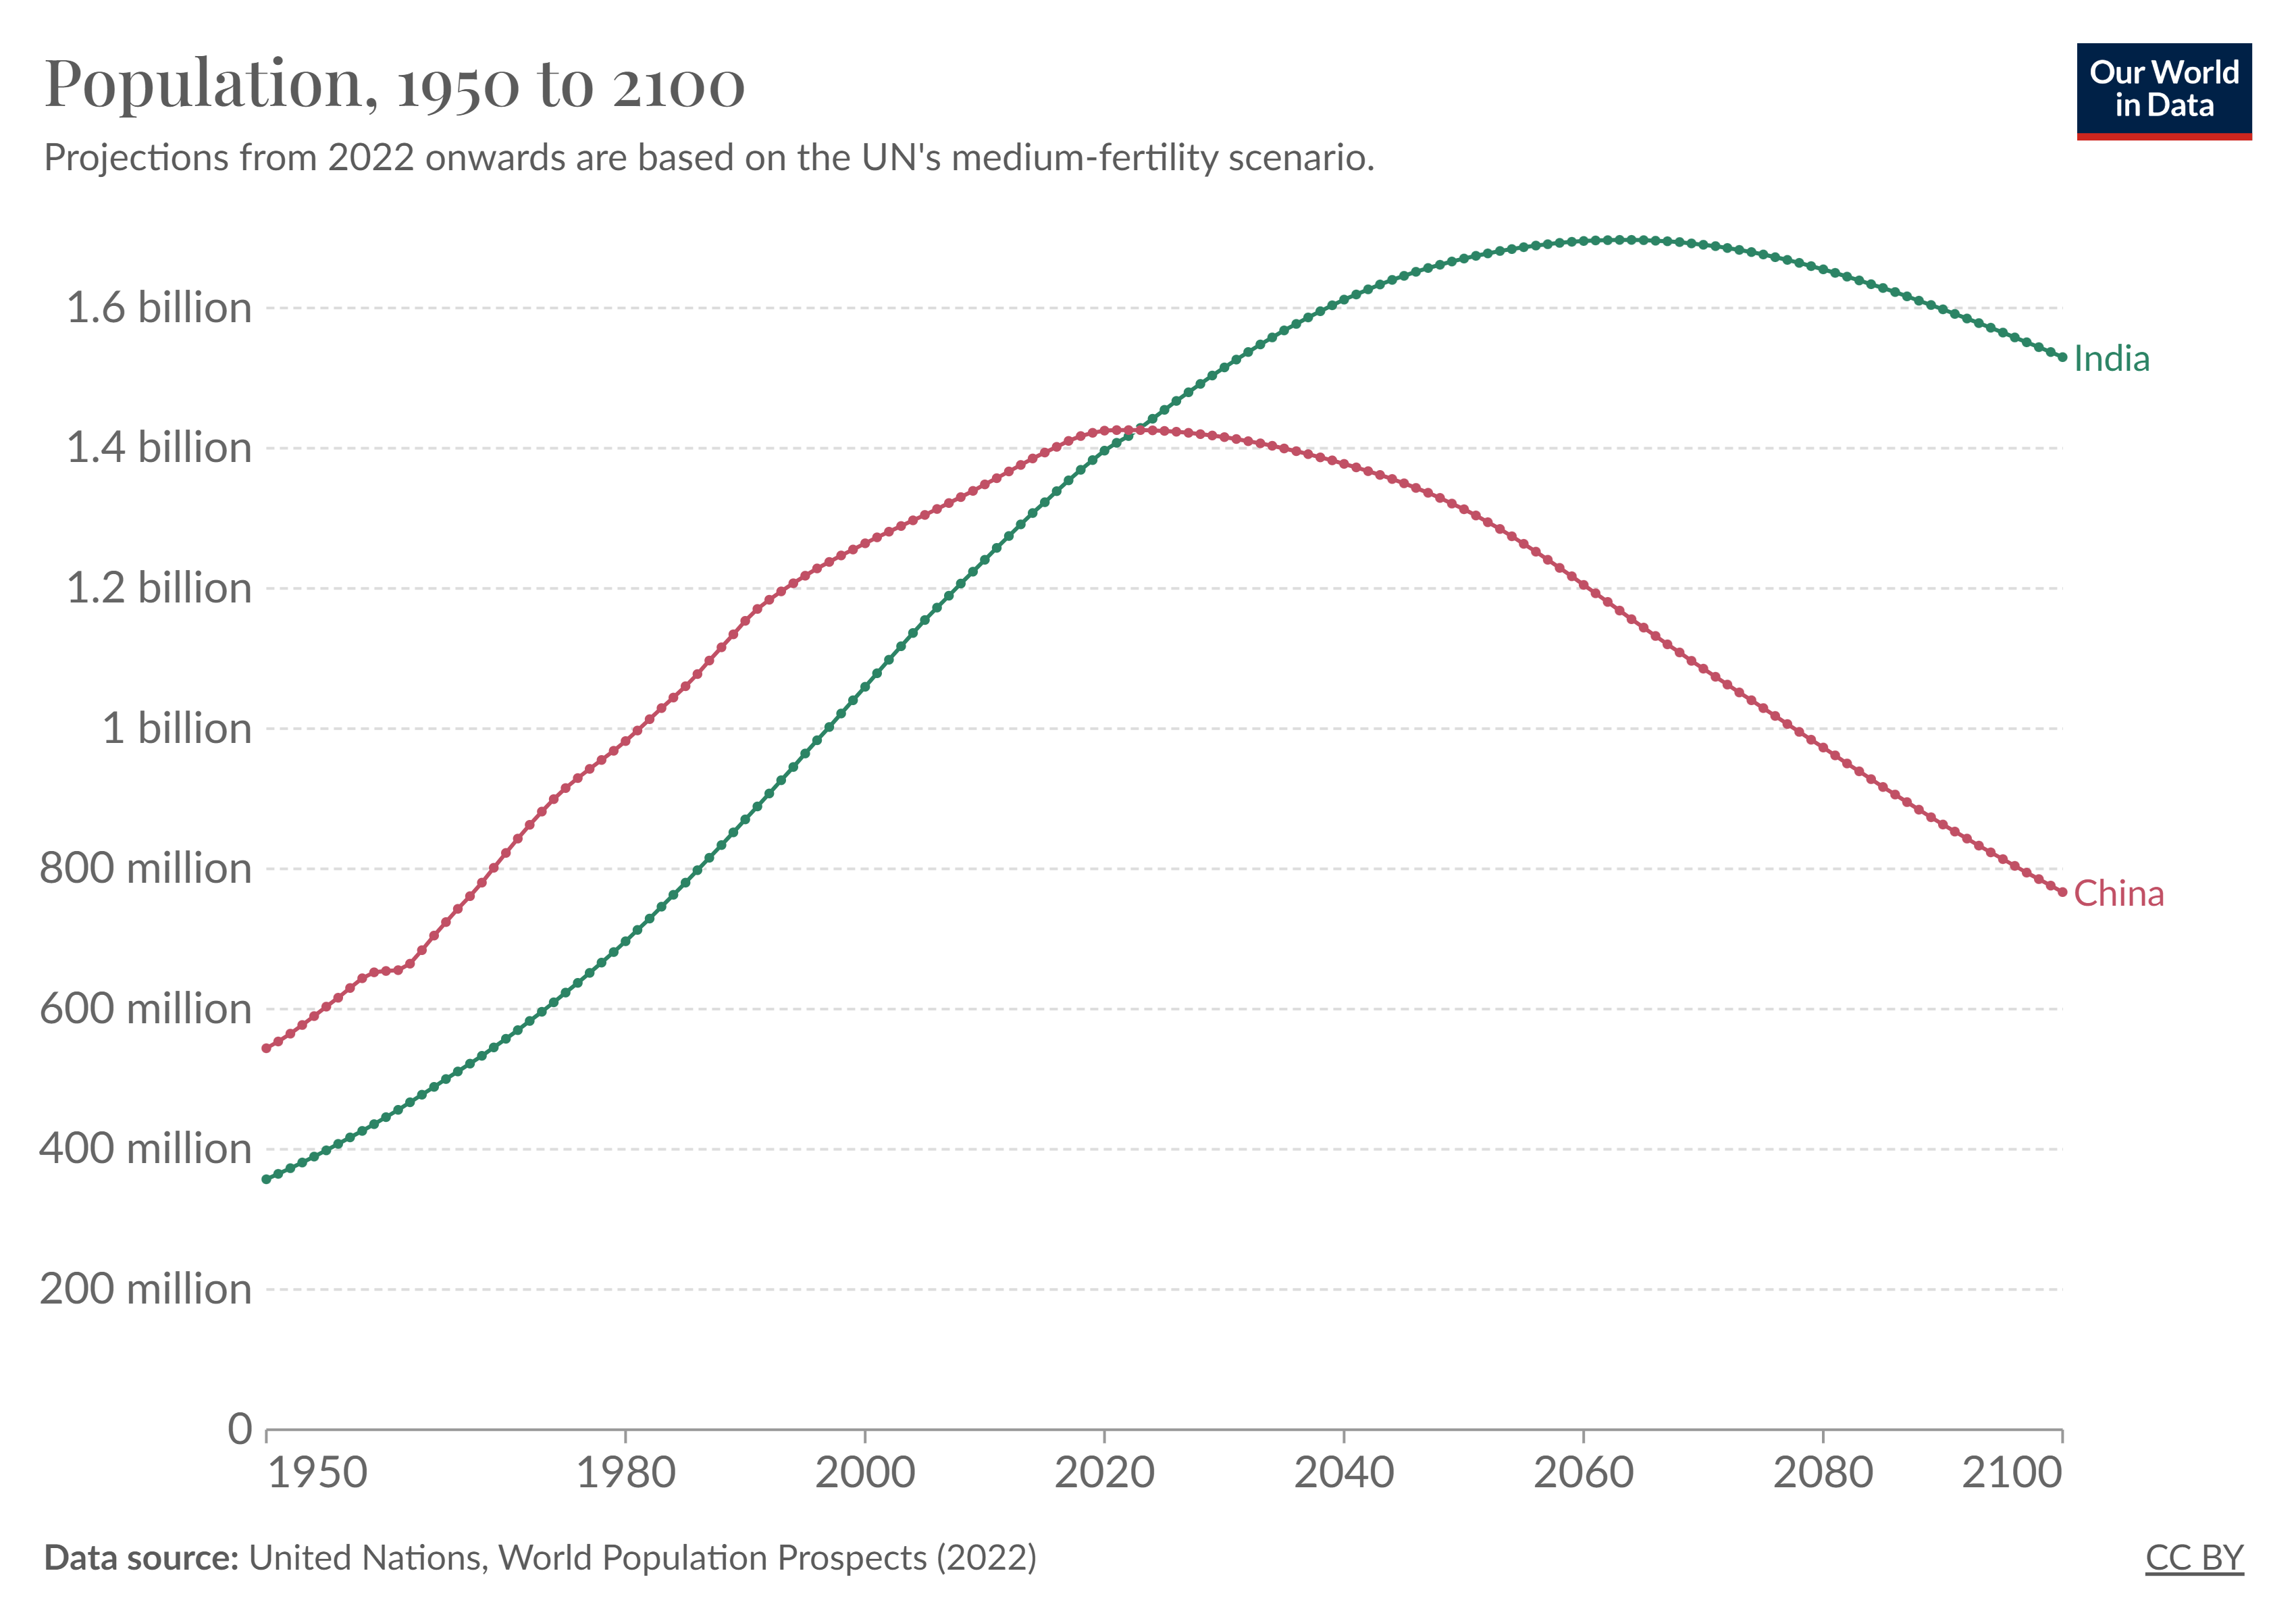
On the UN’s projections, the total – not just working age – population of India has now almost certainly surpassed that of its more prosperous neighbour and the divergence is set to grow sharply in the years ahead. In twenty years time, India’s population – both total and working age – looks set to be around 50% larger than that of China. Such a profound shift cannot be ignored when thinking about the long term health and prospects of these economies.
data as at: 20/11/2023
Back in 1980, there were around 50% more potential workers in China than India. Even a decade ago China possessed almost one billion people of working age compared to fewer than 850 million in India. But now the totals have almost aligned. Lower Chinese birth rates have finally started to drag the working age population rate down.
On the UN’s projections, the total – not just working age – population of India has now almost certainly surpassed that of its more prosperous neighbour and the divergence is set to grow sharply in the years ahead. In twenty years time, India’s population – both total and working age – looks set to be around 50% larger than that of China. Such a profound shift cannot be ignored when thinking about the long term health and prospects of these economies.
data as at: 20/11/2023
For those thinking very long term, the latest UN projections suggest an even more profound demographic shift lies in the future.
data as at: 20/11/2023
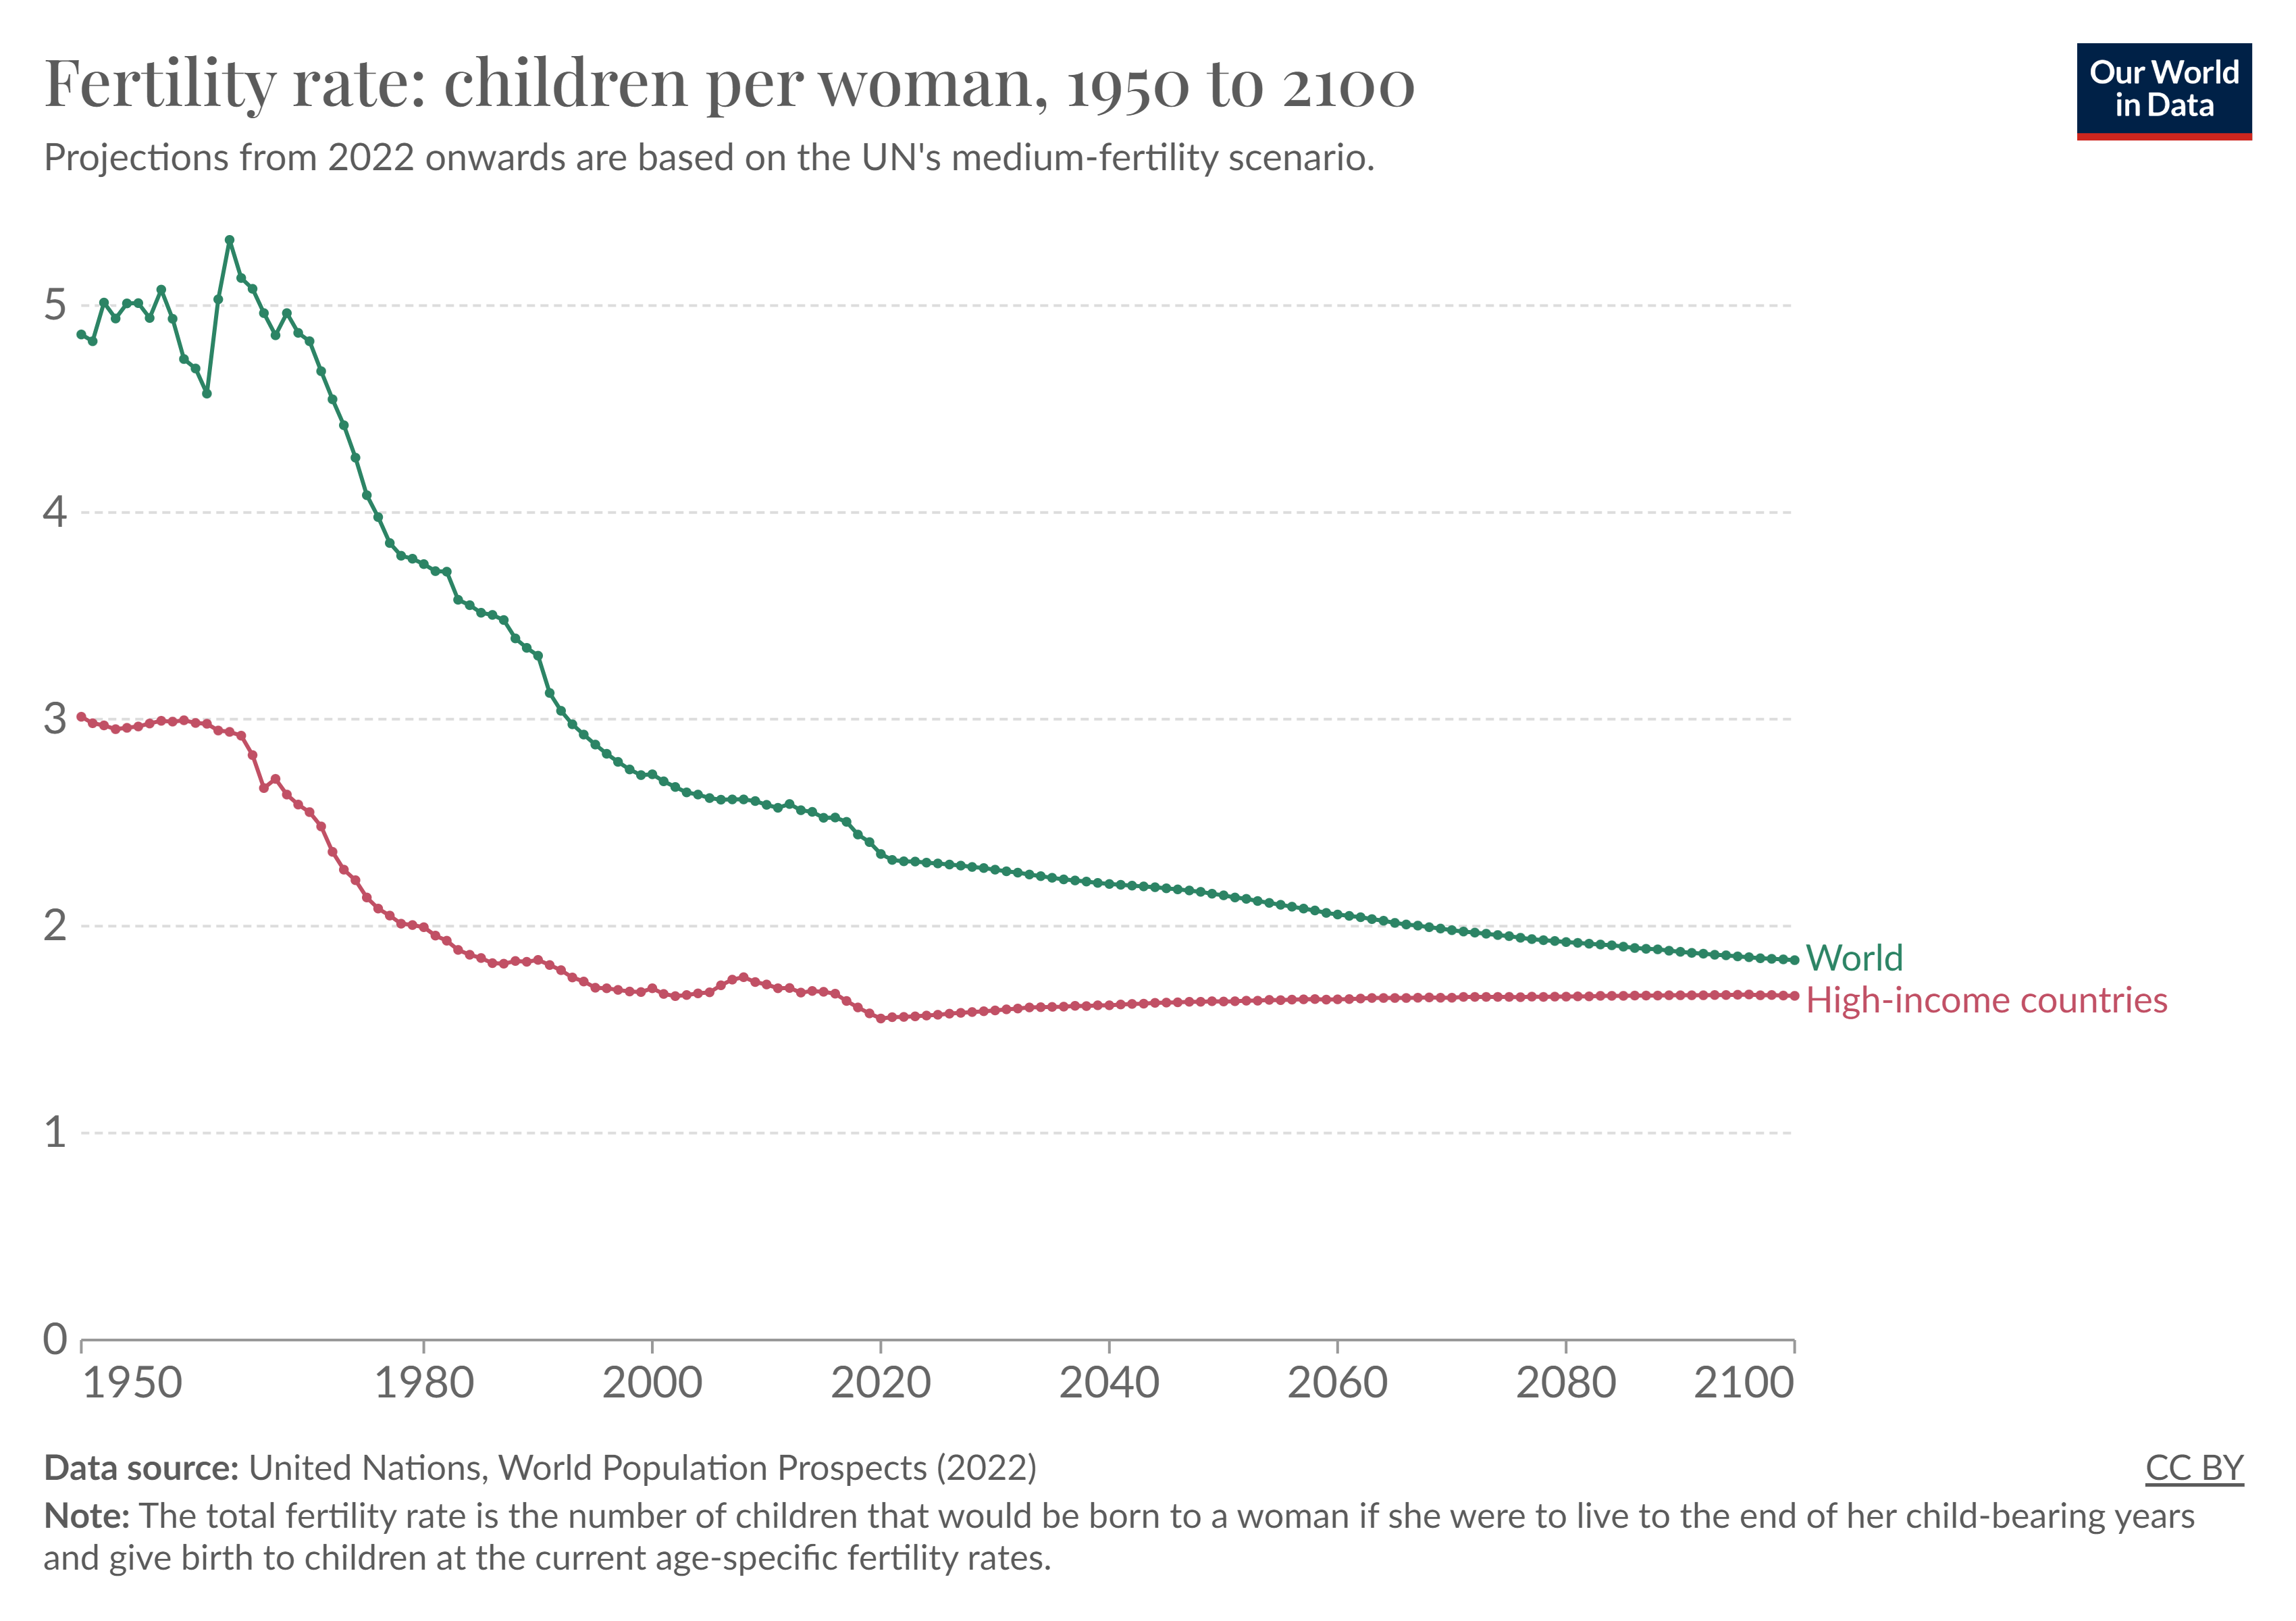
The global fertility rate – the amount of births the typical woman will have over her lifetime – has fallen from more than 5 in the 1950s to 2.3 today – and from more than 3 in rich countries to 1.6 today. The UN reckon that the global fertility rate will drop below 2 – or the replacement rate – in the late 2060s. If that was correct – the peak in global population would be hit at some point later this century.
It is easy to get distracted sometimes by noisy short data – whether that is quarterly earnings or the latest inflation numbers. But it is always worth pondering the longer term, bigger picture. For macroeconomics, it doesn’t get any bigger than demography.
|
WHAT WE ARE WATCHING 8th December, US Wages – US wage growth rose to an annual pace of 5.7% in the Spring of 2022 -the fastest rate in decades. Tighter monetary policy has seen wage growth slipping each month since to just 4.1% in the latest numbers. But the pace of decline has slackened off and tightness in the jobs market may, some worry, see a pick-up possibly beginning as soon as the December numbers. A reacceleration in cost pressures is exactly what the Fed does not want for Christmas. 11th December, China Inflation – Chinese CPI inflation went negative in the November release, with the country falling into a mild spell of deflation and the price level dipping 0.1% over the previous 12 months. The authorities will be watching this closely. Any material increase in the space at which prices are falling would likely prompt a policy response. 14th December, UK rates – At its last meeting the Monetary Policy Committee voted by 6-3 to hold rates constant with the three dissenters favouring tighter policy. Whilst no immediate change is expected in December, markets are closely watching the number of minority votes. As long as three or more MPC members favour tighter policy it is hard to conclusively argue that UK rates have peaked. |