SORBUS spotlight: Europe
The headlines about the Eurozone’s economic performance often mislead as much as they inform. All too often the fortunes of Germany, the single currency zone’ largest single component, are misrepresented as conveying the whole story. Often, such as now, this is simply not the case.
Germany’s economy has had a difficult run. The pandemic – and the distribution in global trade- hit the export-led growth model especially hard. A large degree of dependence on Russian energy – and a sizable volume of exports to Russia too before 2022 – have caused new pain over the last 18 months. Germany has met the criteria – two back-to-back quarters of economic contraction – usually used to define a recession.
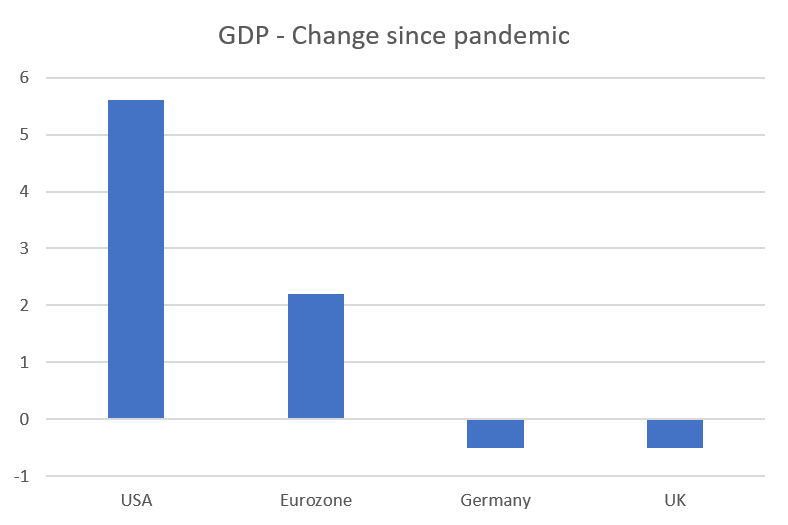
But Germany is not the entire Eurozone. A broader look back at economic performance since the pandemic hit in the first quarter of 2020 is useful.
source SORBUS PARTNERS, commons library UK (data as at 20/07/23)
Germany and Britain have, despite arriving via different routes, ended up with the same 0.5% of GDP gap from their pre-pandemic peak. But the single currency zone as a whole, including the negative contribution from Germany, has grown by just over 2%. Of course 2% growth over a period of more than two and half years would normally be nothing to celebrate – as it stands it is ahead of what Japan has managed but much below the exceptional performance of the United States.
The broader point though is that, despite the much-touted troubles of Germany and the entire region’s exposure to the Russian energy price shock, the Eurozone has posted steady but unspectacular growth numbers over the past two years.
More interestingly the longer-term picture is nowhere near as grim as often believed either. Commentators looking to either emphasise US outperformance or play up Europe’s failings are wont to draw on supposedly straight forward estimates of the size of various economies. Fifteen years ago the Eurozone’s GDP, as measured in US dollars, was just over $14 trillion. Today, measured again in US dollars, it is little changed. By contrast US GDP, over the same period and also measured in dollars, rose from around $14.5 trillion to around $24 trillion. That certainly sounds like a stark difference, a story of a US and a Eurozone which were on almost level footing 15 years ago but where one economy is now more like 50% bigger again.
The problem with such a tale – compelling as it is to tell – is that measuring the size of two economies over 15 years in dollar terms is far from straightforward. Not only does such a measure ignore inflation but, more importantly here, it ignores exchange rate variations. Over a decade and half, varying rates of inflation and exchange fluctuations make such numbers far less meaningful.
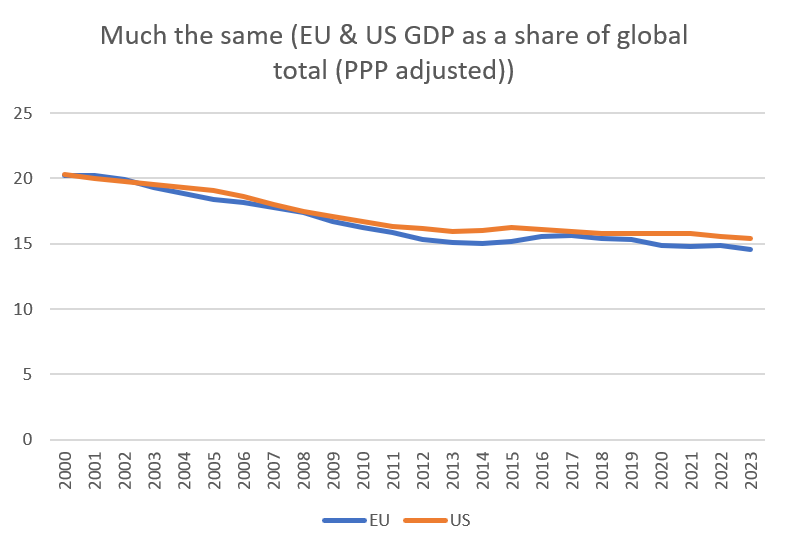
A better measure – specifically designed for cross country comparisons over periods of time – is to use purchasing power parity (PPP) adjusted GDP figures. In theory such numbers should account for differences in national price structures and give a cleaner read on the underlying economic performance.
source SORBUS PARTNERS, IMF (data as at 20/07/23)
The above chart takes the International Monetary Fund’s PPP estimates for the Eurozone – taken as a whole – and the United States and gives their share of global GDP back to the turn of the millennium.
Back in 2000, the United States – on a PPP adjusted basis – accounted for 20.3% of global economic output and the Eurozone for 20.2%. Today those shares have fallen to 15.4% and 14.6% respectively. A decline mostly explained by the relatively quicker growth of East Asia and Eastern European emerging economies over the past two decades. It is true that the size of the US lead over the single currency zone has grown over the last 23 years from about 0.1% percentage point of global GDP to 0.8 percentage points of global GDP, it is hardly a dramatic shift.
Whilst US financial markets have hugely outpaced their Eurozone equivalents – certainly since 2009, the underlying economic performances are more similar. One large difference is Europe’s lack of a tech centre on anything like the scale that has produced Facebook/Meta or Google/Alphabet this century. Another crucial difference is that US economic growth tends to skew more towards profit growth than real wage growth, giving a kicker to asset prices.
Having established that much of the recent gloom on the Eurozone’s economic performance – both in the short term and the longer run – is at best misplaced and that the single currency zone has a similar economic weight to the United States it is worth asking if the zone has the potential for a pick-up in growth as the US economy looks increasingly sluggish? Can the Eurozone pick-up the slack of a slowing US and provide global growth with a much-needed fillip?
source SORBUS PARTNERS, OECD (data as at 20/07/23)
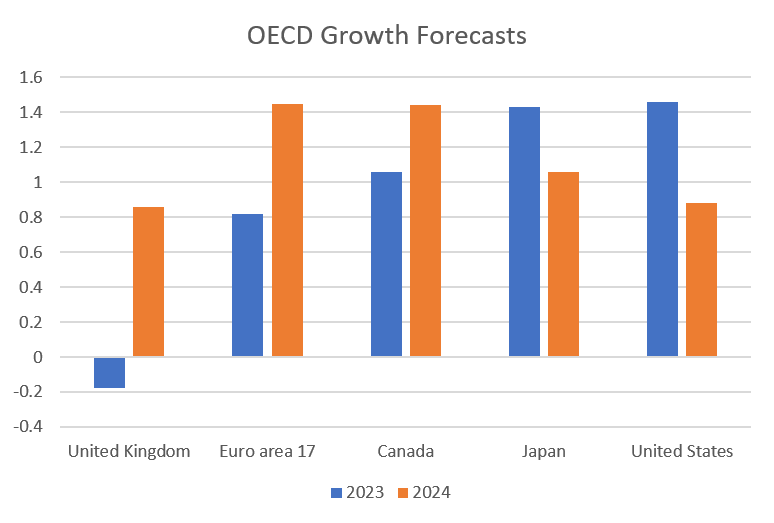
The OECD and other major forecasters certainly seem to hope so. Indeed over the course of 2023 and 2024 as a whole, the OECD reckons that the United States and the Eurozone will grow by similar totals but with the US taking the lead in 2023 and the Eurozone in 2024. If those sorts of estimates are going to be proved correct then it is now, in mid 2023, that higher growth momentum should start to become visible in Europe.
That may well be finally happening, or at least if Europe is not accelerating any quicker it may soon be receiving less of a brake. European inflation is falling fast. It peaked at 10.6% last October, was down to 8.6% by January and fell to 5.5% in June. Something close to 3% by the end of the year looks increasingly possible as energy prices continue to fall.
source SORBUS PARTNERS, Indeed Hiring Lab (data as at 20/07/23)
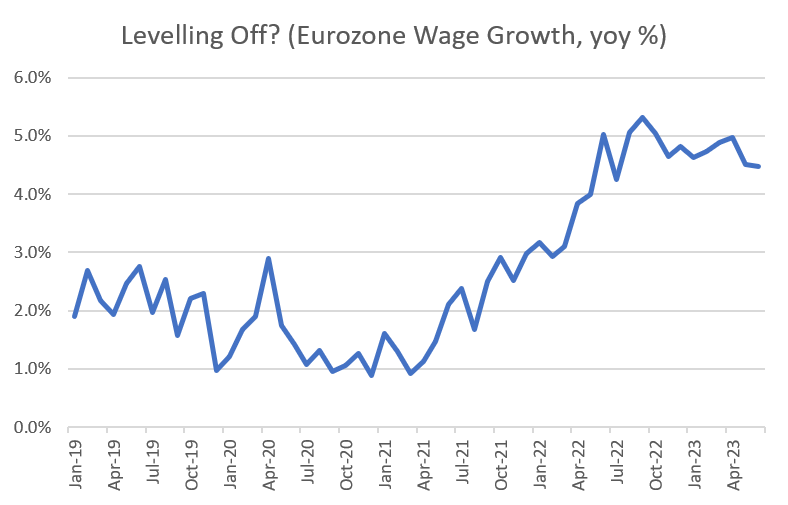
Unlike in the United States and Britain, European jobs markets never became super tight. While European unemployment has fallen it is still 5.9%. Wage growth never hit the highs seen in the English-speaking economies. What is more, wage growth has plateaued around 4-5% for the past 12 months rather than accelerating further.
In other words, domestically generated inflationary pressure is materially lower in the Eurozone than in Britain or North America. All of which points to the European Central Bank being much closer to its peak in tightening than the Federal Reserve or Bank of England. The best reason for economic optimism on the Eurozone is the most straightforward: it requires less slowing from its own policy makers. That though will likely prove enough to let the Eurozone put in a, in relative terms, strong performance in 2024.
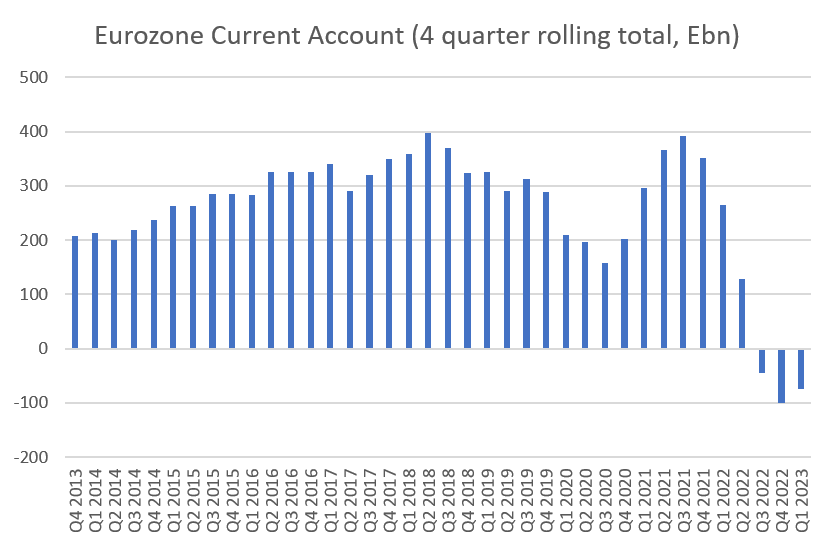
It may also possibly give the space for a more impressive European economic recovery. In contrast to the US or UK – both net importers, the Eurozone has traditionally been a surplus economy exporting more than it imports.
The pandemic and the squeeze on global trade followed by the energy price shock and sanctions on Russia saw a big turnaround in the zone’s current account – which fell from a large surplus into deficit in recent quarters.
source SORBUS PARTNERS, ECB (data as at 20/07/23)
Lower energy prices should help reduce the import bill going forward but an early peak in interest rates might provide a useful boost to European exports too. If Europe’s inflation dynamics allow its rates to peak at a lower level there may be space for the Euro to weaken in value and provide a useful source of support for European exporters.
The Eurozone has put in a solid but unspectacular economic performance since the pandemic – lacking the drama of Britain’s series of mini-crisis or the excitement of the US’s rapid recovery and equally rapid economic overheating. Given the zone as a whole’s exposure to Russia and the energy price shock the performance has been almost creditable. A continuing steady but unspectacular performance in 2024, as the United States deals with the consequences of its prior overheating, is exactly what the global economy needs.
If policymakers in the US initially hit the accelerator too hard and have been forced to now slam on the brakes those in Europe were if anything too cautious with the accelerator. Now though they have built up a nice level of speed and can hopefully motor on. Until the next crisis.
|
WHAT WE ARE WATCHING 10th August, US Inflation. While US inflation has peaked, it may not yet be falling fast enough for the Fed’s tightening cycle to be at an end. The Fed will want to see core CPI falling at a materially faster pace. 11th August, British GDP. Britain – at least for now – looks to have avoided a much feared recession. But the full figures for the first half of the year are likely to show a stagnated rather than a growing economy.
|