SORBUS spotlight: US interest rates are hurting. But they are also working.
The US Federal Reserve, unlike the Bank of England, paused its cycle of rate increases at its latest meeting. But its governing board were keen to signal that the peak is not yet in with their so-called ‘dot plot’ – the economic projections of the policymakers – pointing to two more hikes in 2023.
There is no doubt that the steep rise in borrowing costs over the past two years has been painful for US firms and households – mortgage rates, as across the Atlantic, have risen to their highest levels in 20 years. But unlike in Britain, the policy seems to be finally paying dividends. US inflation looks to be coming under control.
Understanding why monetary tightening seems to be, finally, working as intended in the US requires understanding the nature of American inflation and how it differs from that experienced in Europe. The nature of the energy price shock was very different in the US – a country far less exposed to Russian supplies and less dependent on natural gas – and, more importantly, the initial economic response to the pandemic took a very different path.
One way to characterise the US fiscal response to the pandemic would be to simply brand it ‘large’. A better term though might be ‘absolutely huge’.
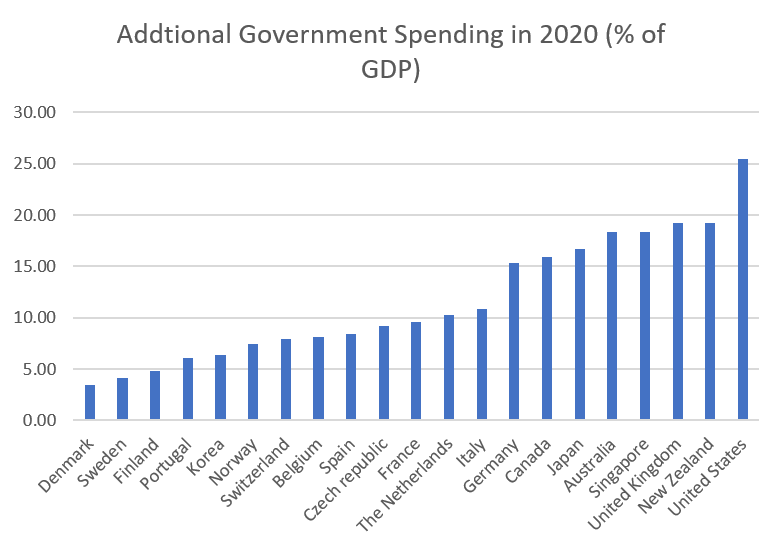
source: SORBUS PARTNERS, IMF (data as at 23/06/23)
In magnitude, and expressed as a share of GDP, the extra US fiscal largesse in 2020 was higher than that of any other advanced economy. Indeed it was more than twice as large as the advanced economy average. Simply put, it was the largest peacetime fiscal expansion carried out by any advanced economy on record.
The US approach did not just differ from that of Europe in scale, it also followed a fundamentally different path. In general the British and European way to manage the economic fallout from lockdowns was to attempt to support employment and keep workers attached to their jobs. The British furlough scheme, and various European short-working time initiatives, saw the state stepping in to pay furloughed workers 60-85% of their previous salaries (the exact rate varied across geographies). By contrast the US approach focused on people rather than jobs. At the centre of their approach was sending cheques of $1,200 per person (plus $500 for every child) to households whilst also ramping up unemployment benefits to previously unforeseen levels. Rather than subsiding firms to keep workers on their books, they instead allowed unemployment to spike whilst instead protecting household spending power.
This already represented a fiscal giveaway of previously unimaginable levels, but in the context of the shock of 2020 it perhaps made economic sense. The US certainly enjoyed the fastest recovery of any major economy from the pandemic. Less explicable from the straightforward economic perspective was the second round of stimulus launched in early 2021 from the incoming Biden administration.
The best way to grasp just how unusual the recent US business cycle has been is to look at the most straightforward of indicators: the raw number of Americans in work.
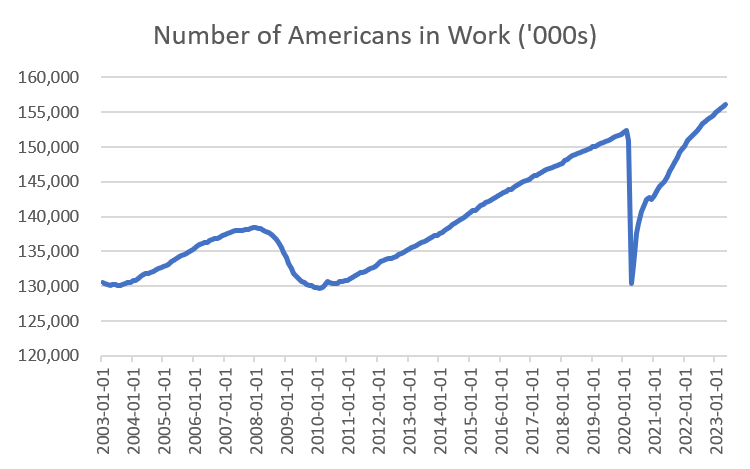
source: SORBUS PARTNERS, Federal Reserve Economic Data (data as at: 23/06/23)
Two things immediately stand out. The 2020 crisis saw an almost immediate fall in US employment with some twenty million job losses in just a few months. That is twice as large – and three times as fast – as the job losses experienced in 2008-09, until recently regarded as a once in a century scale of crisis.
But even more telling than the scale of the job losses has been the pace of the subsequent recovery.
After the banking crisis it took the US six years to return to the previous peak in payrolls. After the pandemic it took just two years to make up a gap initially twice as large.
That post-pandemic hiring boom though saw the first real pangs of rising post-pandemic inflation.
Whilst inflation has been high globally, it has come in three distinct types. Different countries may have experienced the three sorts to different degrees. Firstly, there has been the straightforward pandemic related supply chain disruptions and shifts in demand. Broadly put, 2020 and 2021 saw the average advanced economy consumer spending an awful lot more on goods and an awful lot less on services than in 2019. The typical consumer ate out less, went to fewer pubs, got their haircut less frequently and spent more than was normal on Amazon deliveries. But that swing towards spending on goods came at the same time as goods supplies chains began to break down under the strain of lockdowns. The result was soaring demand for goods coupled with weak supply and hence rising price pressures.
Such inflation was the dominant factor globally in 2021 with used car prices serving as the canary in the coal mine. In the US it was even possible to buy a used car in January 2021, put another thousand miles on the clock and then sell it for a profit that summer.
Such inflation though has faded globally as goods supply chains have corrected themselves and demand has ebbed as consumer services reopened for trade.
Then there was the energy price shock. That began in 2021 as global energy demand recovered faster than energy supply. The trend was super charged by Russia’s invasion of Ukraine. That saw headline inflation levels pushed into the double digits in most economies, although the US – as an energy exporter – suffered much less.
Finally there is the third sort of inflation – the one that has most worried central banks – that emerging from tight job markets and faster wage growth. In 2022 and early 2023, this has been the dominant sort of inflation in the US.
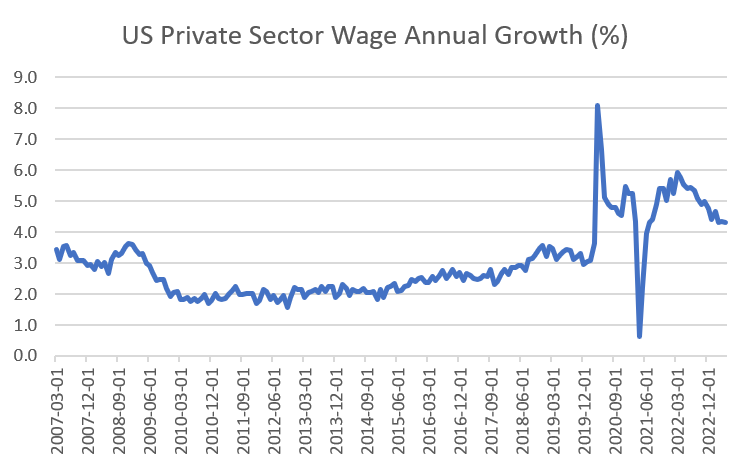
source: SORBUS PARTNERS, Federal Reserve Economic Data (data as at: 23/06/23)
Average private sector wage growth leapt up to 8% in 2021 and was still running above 6% – compared to a pre-pandemic norm of closer to 2.5% in 2022.
But in recent months the pace has begun to slow. Indeed, it has slackened by about one third in the past twelve months and looks set to fall sharply again in the second half of this year.
It is that falling rate of wage growth that sits behind the better recent news on US inflation.
The Federal Reserve, like most other central banks, prefers to focus on core inflation, excluding food and energy. That measure is not only less volatile but also more directly relates to the kind of variables they feel they can exercise more control over with interest rate policy.
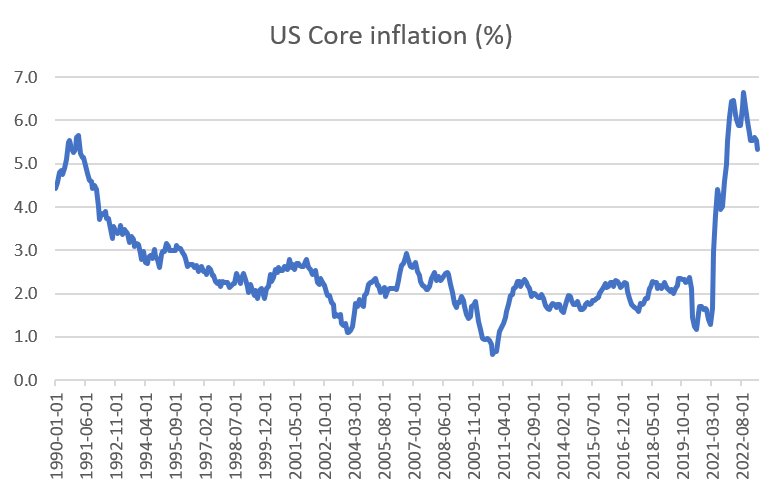
source: SORBUS PARTNERS, Federal Reserve Economic Data (data as at: 23/06/23)
The good news, for the Fed, is that core inflation looks to have peaked around the turn of this year and whilst still high it should fall sharply over the rest of 2023.
By contrast in Britain core inflation continues to climb even as headline inflation is no longer accelerating. The transmission mechanism in the US for monetary policy is much clearer. Inflation has mostly been the result of a hot jobs market – so rate rises which slow the economy and loosen the jobs market should reduce inflation.
The US monetary tightening may have temporarily paused but one should not discount just how high US rates have become.
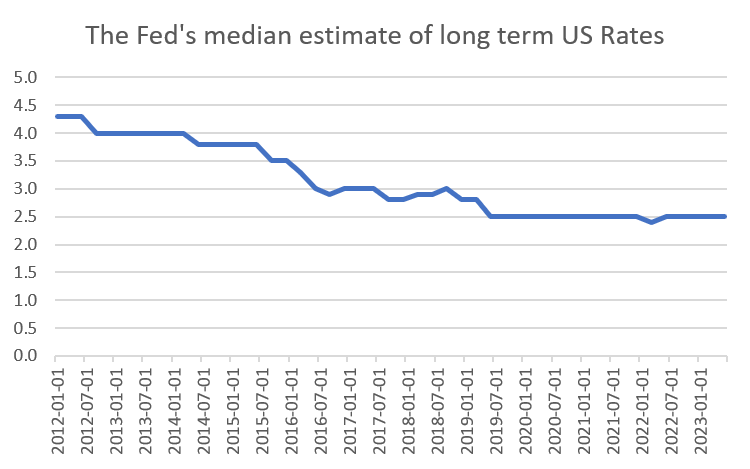
One way to get a sense of this, is to look at what might be dubbed ‘the most stable chart in economics’. Ever since 2012 the Fed’s Board has published a quarterly round-up of their own views of the economy. One variable that they regularly update is their own view on what the Fed Funds (the equivalent of the Bank of England’s base rate) should be in the vaguely-defined long-run. This is essentially their view of what a ‘normal’ or ‘neutral’ Fed funds rate would look like – one that was neither tight and causing the economy to slow, or loose and causing it to accelerate.
source: SORBUS PARTNERS, Federal Reserve Economic Data (data as at: 23/06/23)
The big picture is that throughout the 2010s, the Fed revised down its view on neutral. Whilst it used to think 4.5% was about the normal level of rates it came to realise that demographic changes, rising debt levels and all sorts of other factors had reduced the level of rates in the longer term. In simple terms, if household debt levels double then one might expect the neutral interest rate (the one which is neither a stimulus or a sedative to consumer spending) to halve.
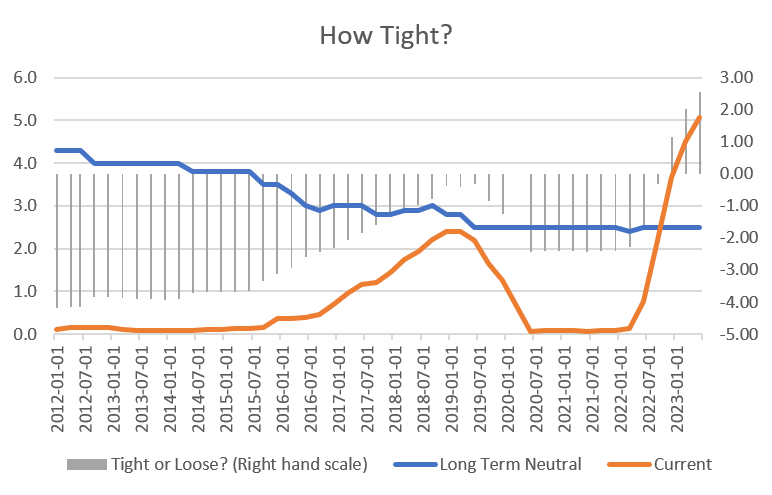
Overlaying the actual Fed Funds Rate onto the Fed’s own view of what is neutral gives a sense of just how tight US monetary policy is – or at least how tight the Fed believes it to be (which is a useful thing to know in and of itself).
source: SORBUS PARTNERS, Federal Reserve Economic Data (data as at: 23/06/23)
The first thing to leap out is that throughout the entire pre-pandemic Fed hiking cycle from 2016 to 2019, US monetary policy never became ‘tight’. It instead simply became ‘less loose’. But the more important takeaway is that the past 18 months have seen a real and clear tightening in US monetary conditions.
The most obvious impact of that sharp tightening is the recent slowdown in US growth. But with that cloud comes an important silver lining, US core inflation is falling. Whilst there may need to be another half a percent or so of tightening to drive inflation back to pre-crisis levels there is at least light visible at the end of the tunnel. US monetary policy is hurting, but it is also working.
|
WHAT WE ARE WATCHING July 7th, US Jobs Market – The US jobs market has come off the boil this year with wage growth slowing. The pace of private sector earnings growth is now a far more useful indicator to watch than the headline change in non-farm payrolls. The Fed will want to see a continuing deceleration. July 12th, UK Financial Policy Committee – For understandable reasons the Bank of England committee that gets the most attention is the rate-setting Monetary Policy Committee. But the Financial Policy Committee – charged with watching the health of the overall financial system – is worth paying attention to. Their reports tend to take a longer term, bigger picture view. With mortgage rates climbing to two decade highs, this release should have helpful details on potential stresses in the banking system if defaults begin to rise. |