SORBUS spotlight: China. A five-chart story.
Rocketing inflation, soaring interest rates, war in Europe and British political turbulence (to put it mildly) have grabbed investors and analysts’ attention in 2022. But when economic historians look back on the early 2020s with the benefit of decades of hindsight they are unlikely to pick Britain’s fiscal U-turns, America’s tight jobs market and rising rates or even the European energy price crisis as the decisive event. In world-historical terms, the collapse in Chinese growth is the big news.
It is hard to understate just how rapid and transformative China’s rise has been. Using purchasing power parity, to adjust for differing domestic prices, the IMF reckons China accounted for just 2.3% of global GDP in 1980. By 1990 that had risen to 4%. At the turn of the millennium it was 7.2% and by the time of the banking crisis in 2008 it was 11.8%. In 2016, on a PPP basis, China’s economy surpassed that of the United States. It now accounts for almost one fifth of global economic activity.
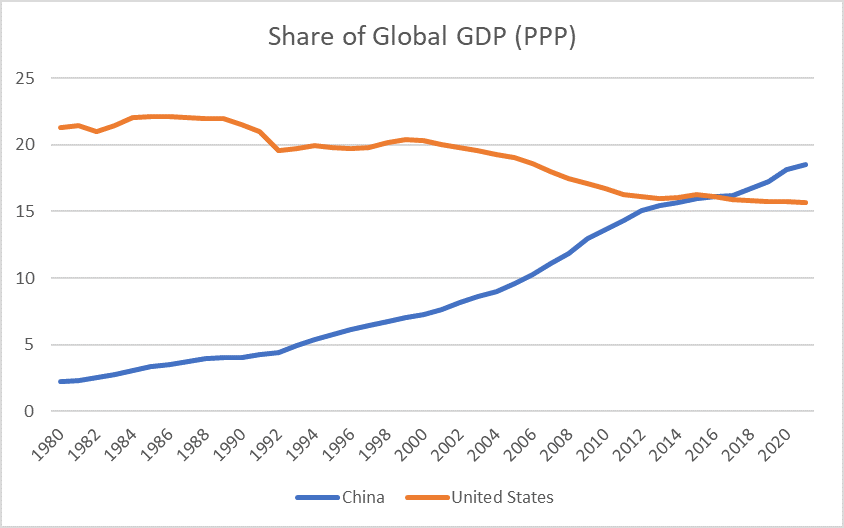
Source: International Monetary Fund, World Economic Outlook Database, October 2022
The world has never seen an economic take-off on such a scale.
But understanding the nature of Chinese growth shines a light on the limitations of its growth model.
The key driver has been a staggering high rate of investment, especially in property and buildings. A look back at pictures of Chinese city skylines over the past two decades tells the story. China produces and uses 60% of the world’s concrete, indeed it used more concrete in the three years to 2014 than the US did in the entire twentieth century.
Investment regularly comprises over 40% of Chinese output, compared to the sub-25% norm in most advanced economies.
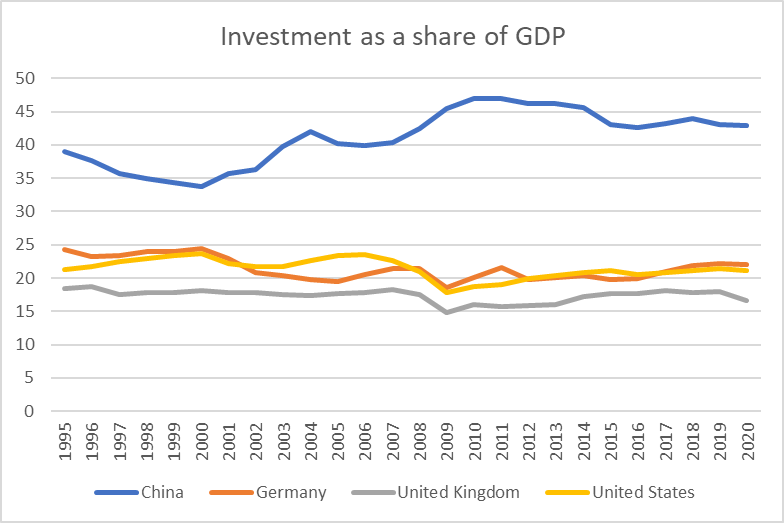
Source: International Monetary Fund, World Economic Outlook Database, October 2022
A building boom can certainly – as China demonstrates – drive growth for a while, even perhaps for decades, but it has its limits as a growth strategy.
The real worry is that much of the investment is really malinvestment. Faced with GDP growth targets set from on-high, the standard response of regional governments has been to simply increase building projects to hit their numbers with cheap finance funnelled in via state owned banks and local authorities.
One measure of the efficiency of economic investment is the ratio of investment spending to GDP growth. And on that measure, a warning light has been flashing over Chinese growth for a decade.
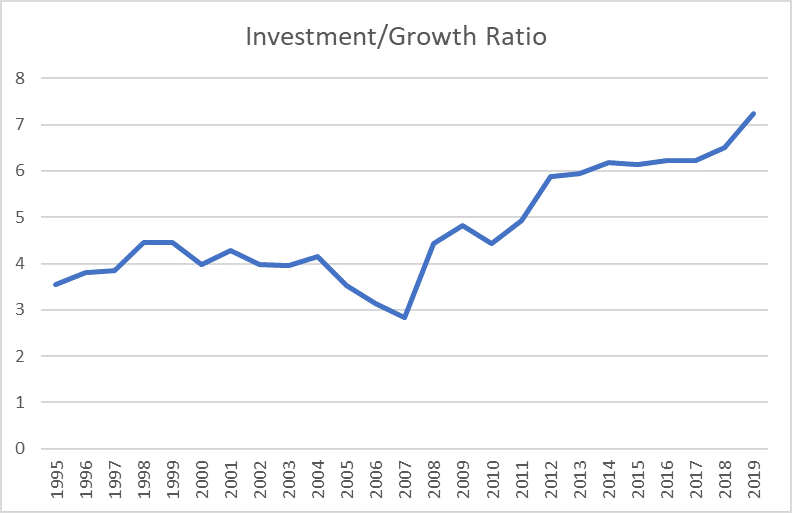
Source: International Monetary Fund, World Economic Outlook Database, October 2022
Back in the late 1990s the ratio stood at around 4x. That is to say for every four dollars invested, annual output grew by a dollar. But over the last decade that ratio has been heading up. In 2019, the last pre-pandemic year, it took over seven dollars of additional investment spending for every one dollar of output growth.
The end result has been a surge in the number of unnecessary buildings and a large build up in debt. Accurate information on the vacancy rate in China is hard to come by. One major Chinese property firm put the vacancy rate at 7% in Beijing and 12% nationwide in a report in August, about four times as high as in advanced economies. They then withdrew the report and apologised for their errors, presumably after being leant on by the authorities. Some estimates put the vacancy rate above 20%. It seems not all that concrete has been well used.
Household debt levels, as a share of GDP, have doubled in the last decade.
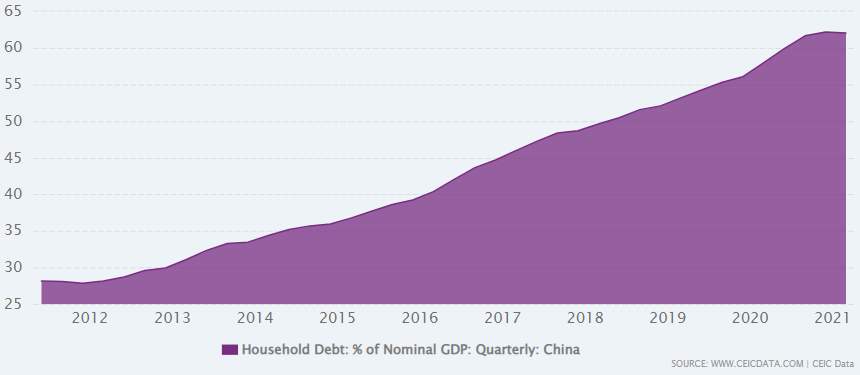
Much of that debt is the form of mortgages which have been heavily subsidised to help prop up the building boom.
Corporate debt has been high for years.
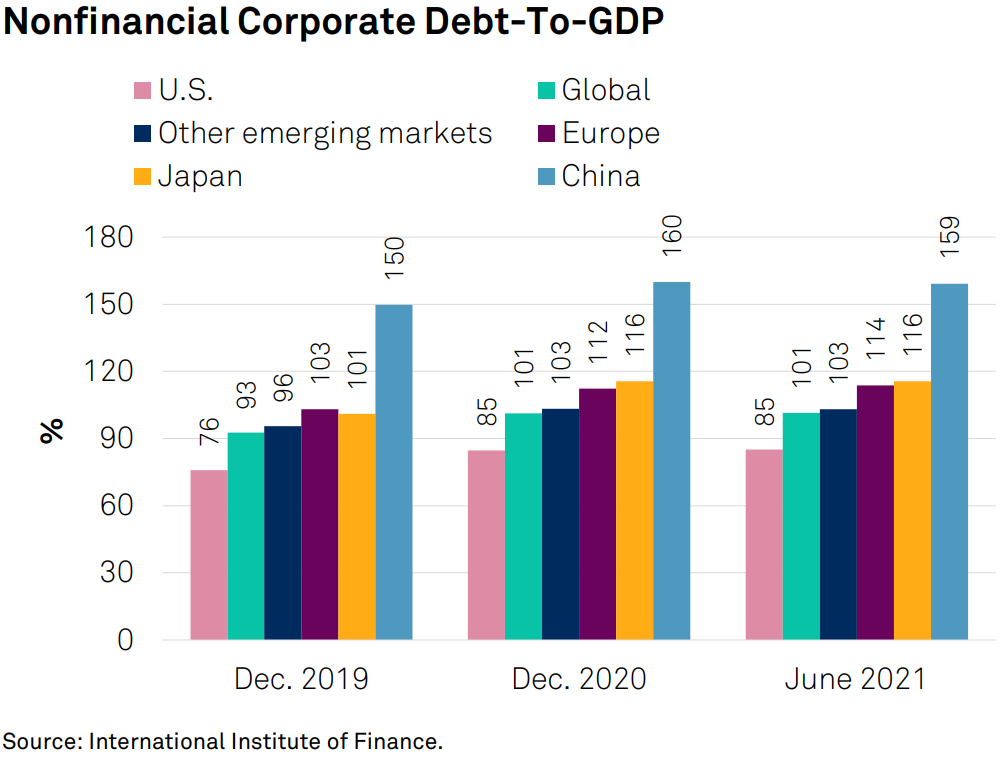
S&P, the global ratings agency, reckons that China accounts for around one third of all global corporate borrowing. Almost half this debt (45%) is accounted for by construction and real estate firms and almost three quarters of that debt is from firms classified as heavily indebted.
In mid-2020 the Chinese government acted to slow real estate growth by imposing new lending criteria on firms and households. Under the so-called three red lines approach unless firms meet three criteria their ability to take on new borrowing has been limited:
(1) a 70% ceiling on liabilities to assets, excluding advance proceeds from projects sold on contract; (2) a 100% cap on net debt to equity; and (3) a cash to short-term borrowing ratio of at least one.
Property investment stalled in 2021 – driven by ongoing covid lockdowns as much as new financial restraints – and fell by around 8% between January and September this year.
Falling construction spending has pulled the rate of GDP down to around 4%, half the norm of the late 2010s. Other measures of activity – such as rail freight volumes, electricity usage and traffic levels all point to a sharper slowdown than the official figures suggest. Growth next year looks set to be around 3%, well below the official target of 5.5%.
On one level the authorities in Beijing have been deeply unlucky. The steps taken to default the real estate bubble are necessary for the long-term health of the economy but no doubt painful in the short term. It is bad luck that the action coincided with the pandemic. Ongoing local lockdowns and a clamp down on construction at the same time may be more than the economy can take.
The thirty-year building boom that drove the Chinese economy looks to be ending. The challenge for the authorities now will be to manage the fallout as corporate defaults rise.
The ramifications of a slowing Chinese economy will reverberate globally. China is the largest trading partner for much of Asia, the Middle East, South America and Africa.
For emerging markets, a slowing of Chinese demand at the same time that US rate rises are tightening financial conditions is just about the worst macro-combination possible. For the Eurozone – and especially Germany – a slowdown in exports to China, whilst trade with Russia is already effectively suspended, will be almost as painful.
The one silver lining for the global economy in 2023 will be the impact on commodity prices, falling Chinese demand for metals and energy may help cool some of the cost pressures keeping inflation at forty-year highs.
|
WHAT TO WATCH FOR IN THE NEXT MONTH Chinese house prices, 15th November. Chinese property prices dropped by 1.5% in the year to September according to the latest data. That trend may have picked up the pace in the next release. The Autumn Statement, 17th November. With September’s mini-budget mostly reversed the UK government will set out its new fiscal policy in mid-November. Fiscal policy has swung from wildly expansionary in September to talk of a new age of austerity just weeks later.
|