Housing – the invisibubble
Housing prices up by 9.9%”
ONS
“How Help to Buy helped to fuel London’s property bubble”
Daily Telegraph
“The average annual gain over the next five years will be around six per cent”
Royal Institution of Chartered Surveyors
These June headlines provide a sample of views commonly espoused in what remains the most tedious dinner-party conversation, the direction of residential property prices. Governments, quantitative easing, land shortages, restrictive planning processes and greater immigration are all proposed as supporting evidence for the inexorable and inevitable future rise in prices. Nay-sayers point to the diminished affordability of property and even the Governor of the Bank of England warning that the housing market poses the single biggest threat to the economic recovery.
However the headlines are infused with unexplored assertion and some of these supposed factors are not as real as people commonly perceive. It is time for some critical analysis to see if all of these components stand up to scrutiny.
“Property is expensive.”
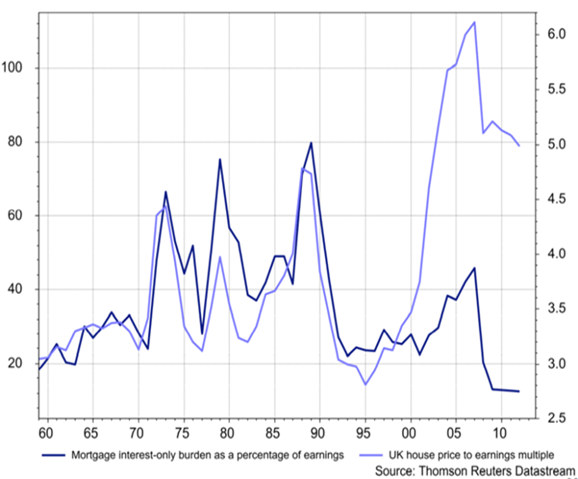
If we start off with the assertion that “property is expensive” then confusingly there is strong evidence to both support and deny this. The two most reliable data points: the UK house price to earnings multiple (how many years of the average earner’s salary is required to buy the average house), and the mortgage interest burden as a percentage of earnings show that housing is both expensive and cheap. The data is below and the divergence from a pattern of 35 years of close correlation is striking and we will explore this later.
The paradox of this “both cheap and expensive” position is best explained by adding that houses are expensive but housing is not.
The provision of credit from a combination of minimal interest rates and subsidised mortgage credit means that the cost of mortgages has never been cheaper – in effect the falling cost of mortgages has more than compensated for the rising amount of money borrowers require to buy property.
The expensiveness of houses is also an area where the data is not presented clearly; most obviously when the ONS says the average property price is over £250k and yet the Halifax and Nationwide surveys report the figure as being closer to £185k – not a small difference. The problem here is how the data is collected and calculated. The ONS only uses transaction data (prices at which houses are bought and sold) when compiling its data – this is certainly more defensible than using “estate agent estimates” with all their inherent biases – but it skews the outcomes as follows.
Imagine a village in which there are ten houses; nine of which are worth £100k and the tenth (the Hall) is worth £1m. The median house price (the middle value) is £100k, the mode (the most common) house price is £100k, yet the average is £190k, almost twice the median. This is not manipulating the data or “duking the stats” merely the impact of outlying large numbers in statistical analysis when using arithmetical rather than logarithmic data.
As a further example if “The Hall” rose in price by 10% then, even if every other house price in the village was unaltered, the average price would be deemed to have risen by over 5%.
In this example if we replace the “The Hall” with “London and the South East” then the picture of why the statistics are misleading becomes clearer. What makes the distortions greater is that proportionally more transactions take place in London than in the rest of the UK. “The Hall” changes hands more often than the other houses in the village so its greater value and recent price rises are again disproportionally inflating the average house price data.
“A growing population and static housing supply”
We all know this to be true…but if it is then why are rents not rising? There are always houses being built and renovated but the question is whether the building rate is keeping pace with the increasing population – the per-capita housing stock. Between 1970 and 2000 it is estimated that the per-capita housing stock increased by 70%.
In 2012 the number of houses in the UK rose by 0.6%….as did the UK population. In fact the amount of housing per capita has been broadly stable for the last fifteen years. There appears to be a housing shortage everywhere except in the data.
If a lack of supply were the principal lever on house prices then rents (in real terms) would be rising fast. That they are not suggests we need to increase the emphasis we place on the unusual credit conditions and de-emphasise the supposed supply constraints.
“The interest rate bubble”
House prices only look reasonable if low/zero interest rates are here to stay. While the Governor of the Bank of England surprised a few with his statement that “The time when it becomes appropriate for interest rates in the UK to start to rise back to a more normal level is approaching”, interest rate rises are inevitable and the interest rate bubble will slowly deflate. However the most important issue is not whether interest rates will rise or even the timing of when they do, but the eventual terminal position – what the “new normal” might be.
If we assume for the sake of example that with sluggish economic growth and diminishing productivity growth then interest rates will top out at 4% then it suggests that house prices are overpriced relative to incomes by around 20%.
As we discuss elsewhere in this review an asset being expensive is seldom a guide for short term price movements. There is little on the horizon to suggest that the house price momentum will be checked in the coming months, and the market looks to be lacking the frenetic behaviours associated with the latter stages of a “bubble”. However, the current trajectory of interest rates (upwards and possibly sooner rather than later) suggests that prices will be hard to maintain at current levels even if the construction of new houses ceases.