SORBUS spotlight: How far from 2%?
Few things will matter more to the UK’s economic performance in 2025 as the course of inflation. And yet the outlook is unusually cloudy.
source: SORBUS PARTNERS LLP, ONS (data as at: 16/01/25)
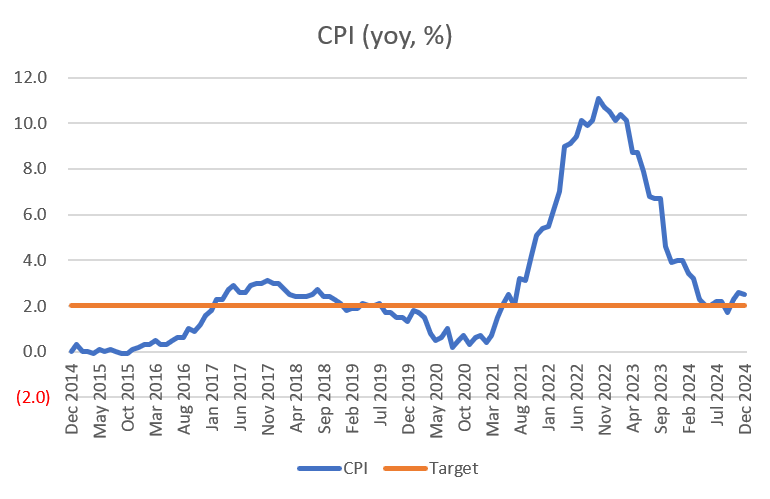
The straightforward chart of consumer price inflation (CPI) in Britain over the last decade has now become something of an economic Rorschach Test. It is possible to, optimistically, focus mostly on the large fall in price pressures over the 2023 and 2024 and be reassured that Britain’s inflation problem is in the past. But is it equally possible to look more closely at the data for 2024 and note that there has been very little progress on bringing inflation down since the Spring of that year.
Of course, both views contain some truth. Inflation has fallen materially from the multi-decade highs of 2022 but it also appears to have settled at around the 2.5% level which, whilst obviously better than two digits, is still uncomfortably above the Bank of England’s 2.0% target.
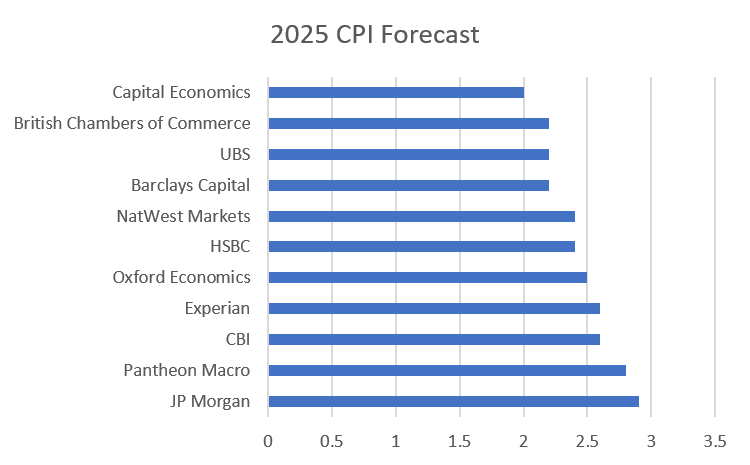
Looking ahead the outlook reflects this divergence. Each month the Treasury published a round-up of economic forecasts by third party economists. The chart below shows the range of estimates for the rate of CPI inflation at the end of 2025, taking only the most up to date forecasts – i.e. those made in December 2025.
source: SORBUS PARTNERS LLP, HM Treasury (data as at: 16/01/25)
The difference between a forecast of 2% and, say, 2.5% may not sound like much. Certainly, after a period of dealing with inflation in the 5-10% range they both sound much better.
But in reality, such seemingly small differences could have a major impact on the course of economic policy. It is worth remembering that the Bank of England’s, often missed, target is 2.0%. And that policy is mostly set with the aim of having inflation back at target in two years’ time.
In other words, when the Monetary Policy Committee next meets in February, they will be thinking about where inflation is likely to be in early 2027 and setting interest rates appropriately. Given that monetary policy tends to operate on a lag of 18-24 months (i.e. it takes up to two years for the full impact of any change in interest rates to feed through fully into the behaviour of firms and households) that makes sense.
The expected level of inflation at the end of 2025 then is a useful way-point for the Bank to think about. If inflation is below 2.5% by then, then MPC members may feel confident that they are on course to hit their target a touch early and be prepared to lower rates at a faster pace to spur on growth. If inflation is still likely to be stuck above 2.5% by the end of the year, then policymakers might well conclude that they have less room to reduce rates than many would like.
To put it more straightforwardly, if the likes of Capital Economics are correct then the Bank can probably cut rates perhaps as many as four times in 2025, all the way down to under 4%. If those in the middle of the range, such as HSBC are correct then the current market assumption of just two or three cuts this year (down to 4-4.25%) look more likely. Whereas if JP Morgan or Pantheon prove correct then the best hope may only be for a single cut or none at all.
The difference between inflation forecasts of 2% and 2.9% may look slight but the difference between interest rates at 3.75% or 4.75% is a meaningful one for many mortgage holders or firms.
The international context for inflation is worth keeping in mind.
source: SORBUS PARTNERS LLP, ONS (data as at: 16/01/25)
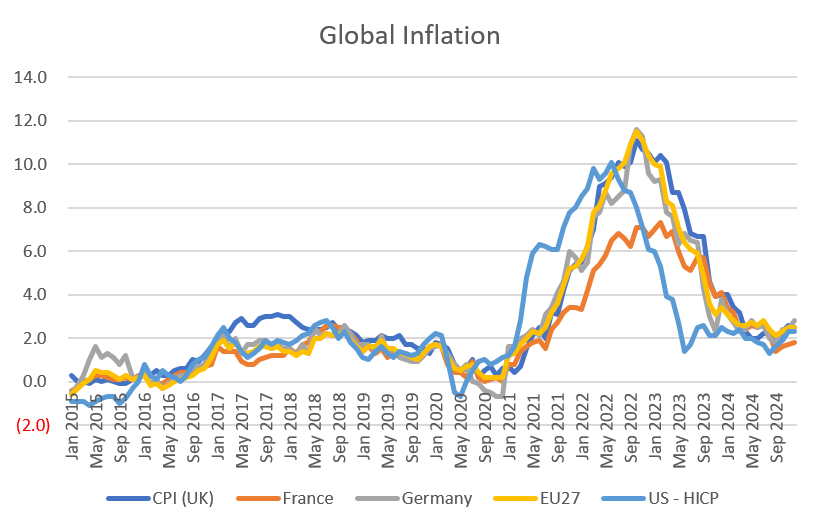
The now familiar chart of the path of global inflation in the rich world provides two useful lessons. The first is that the inflationary spike of 2021-22 and disinflation of 2023-24 were both global phenomena. In general, the pace of price changes was similar. France – like Spain – enjoyed a lower peak mostly because of the structure of the domestic energy market. France’s heavy usage of nuclear power meant a smaller spike in energy prices following Russia’s invasion of Ukraine.
The most useful lesson of the global picture though can be found in America. The US economy recovered quicker from the pandemic recession of 2020 and has seemed to be about six months further along the cycle than its European peers. The US inflation spike began early, peaked early and receded earlier.
Whilst it is possible to read too much into the US experience it does offer valuable clues about the UK’s inflationary future. Notably, US inflation after an initial steep fall has lingered for a long time at levels which are still elevated compared to the 2010-2020 norm and uncomfortably high for consumers.
There are many ways to understand the inflation data. One of the most common is to look at so-called core inflation, which excludes energy and food prices. The argument here is twofold. Firstly food and energy prices are amongst the most volatile of all prices and so excluding them gives a better picture of the underlying trend. Secondly, and more usefully for policy-making purposes, energy and food prices are mostly – but not entirely – determined by global rather than domestic factors. For a central bank, such as the Bank of England, it makes sense to set policy in response to factors over which it has some control. If global energy prices were to (once again) double then interest hikes in Britain would do little to bring prices down.
Of course whilst core inflation might be a useful concept for policymakers, it is not of much use to firms and households. Excluding mostly unavoidable items of spending such as energy and food from the numbers can almost sound perverse to fed-up voters. Indeed some recent research in the United States suggests that for all of the discussion of core inflation in economics, it is precisely the anti-core components of food and fuel that American households care most about.
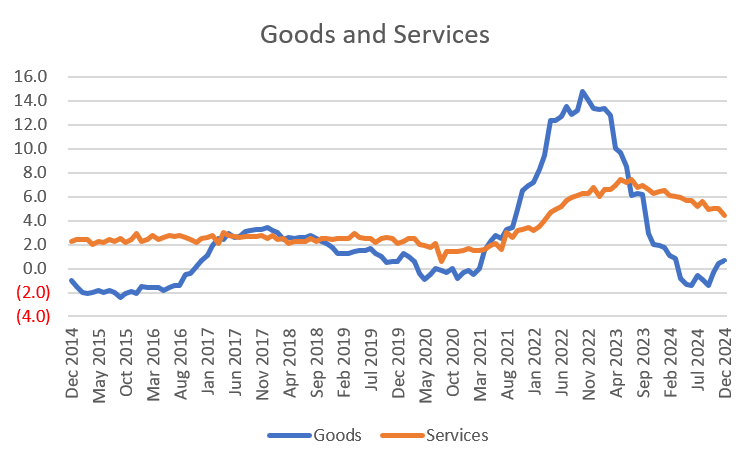
As noted in previous Spotlights, there is a strong case that the simple division of CPI inflation into services and goods (the overall basket is around 54% services and 46% goods) is a cleaner way to break down the data.
source: SORBUS PARTNERS LLP, ONS (data as at: 16/01/25)
The broad rule of thumb is that goods prices are more likely to be determined by global factors whilst services prices are more broadly determined by domestic economic conditions. Whilst there are some exceptions to this, in general goods are more likely to be internationally tradeable and so responsive to international prices whilst services prices are not. A T-shirt can be imported or exported so the price of a t-shirt in Britain is likely impacted by the price of t-shirt in Germany or France. A haircut though can not be.
The goods price spike on the chart, the result of the pandemic related disruptions and then higher energy costs, is dramatic. The movement in service price inflation was more insidious and concerning. Whilst it was always possible to hope that the run up in goods prices would eventually reverse (as it eventually did) the rise in services prices risked being self-sustaining. It was the rise in such prices which prompted the Bank of England to sharply increase borrowing costs and the prospect for further cuts in interest rates hinges on lower service price inflation.
The single biggest input to service sector prices is wages. So ultimately it is the health of the jobs market which matters.
Sadly for policymakers, investors and anyone trying to understand the state of the British economy the official jobs market is a mess. The supposedly gold-standard data, the labour force survey, has suffered from a declining response rate and looks less and less reliable. Bank of England officials have confirmed they are treating all labour market data from the Office for National Statistics with more than the usual pinch of salt.
Given the potential data issues, it makes more sense to look more closely at the real time information provided by HMRC when it comes to pay and employment. This has the advantage of being based on actual incoming tax receipts rather than a survey with a variable response rate. On the other hand, it only captures employees and excludes the self-employed who make up around one sixth of the workforce.
source: SORBUS PARTNERS LLP, ONS (data as at: 16/01/25)
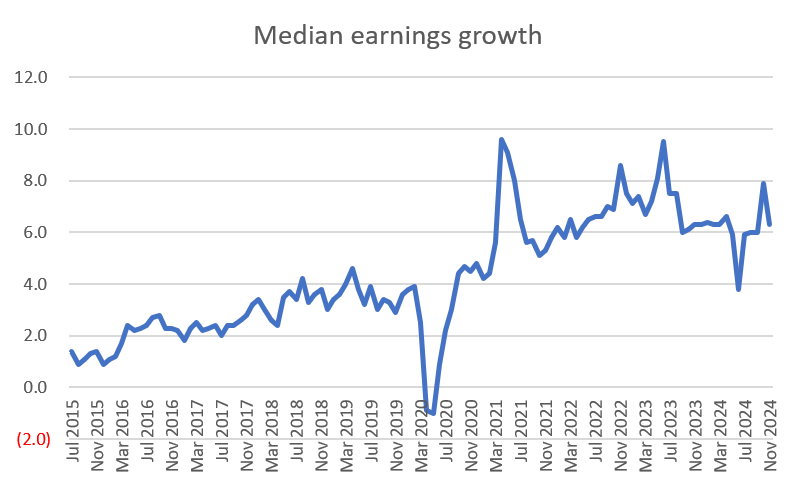
The picture when it comes to pay pressures is tricky to read. The acceleration in wage growth looks to have ended but, around the month to month volatility, wage growth looks to have settled at around 6% per year over the last year. That compares with an annual rate of 2-4% before the pandemic.
It is hard to see services price inflation falling to more normal levels unless the pace of wage growth slackens further.
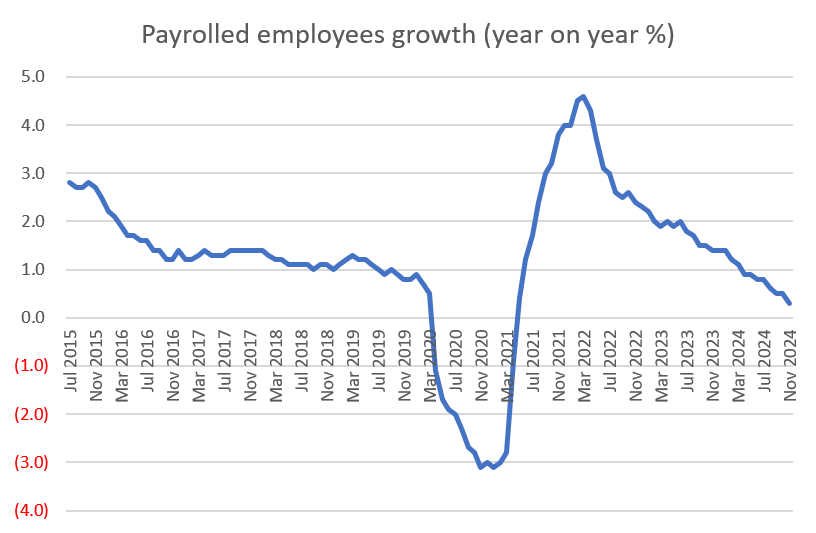
Some comfort can be taken by remembering that wage growth itself is probably a lagging indicator; if the overall jobs market begins to slacken wage growth tends to fall relatively quickly.
source: SORBUS PARTNERS LLP, ONS (data as at: 16/01/25)
The good news for anyone hoping for further rate cuts – and the bad news for anyone hoping for an inflation-busting pay rise – is that the real time HMRC data, based on actual payrolls, does suggest that the pace of job creation is continuing to drop. On current trends, even leaving aside the likely impact of the upcoming hike in employers’ national insurance contributions, job growth will turn negative in the coming months. That is usually enough to bring wage growth, and hence service price inflation, down too.
The much harder to answer question is how quickly will service price inflation fall and how much room does the Bank of England have for further cuts? That is a topic for a future Spotlight.
