SORBUS spotlight: longer and more variable
Regular readers of Spotlight have probably become slightly bored of references to changes in monetary policy taking “a long and variable” time to impact upon the economy. Nonetheless, the point remains a crucial one. One of the things that makes the task of central banking and controlling inflation trickier than it sometimes appears is the fact that the tool primarily used – changing interest rates – takes time to work through the system. What makes it all the more tricky is that the time elapsed between a change in monetary policy being made and its full impact on the economy being felt can vary from, according to most estimates, anything from 18 to 36 months.
The best analogy might be to imagine that central bankers are driving a car but anytime they move the steering wheel there is a delay of between 30 and 60 seconds before the direction of the vehicle begins to change. On a straight and clear road with few turns and good visibility that would be far from ideal, but at least manageable. On a windy road or on a day with poor visibility ahead it would be positively dangerous.
The global economic road has been far from straight over the past few years with the pandemic, the uneven global recovery and a colossal energy price shock; whilst visibility about what lies ahead has been more limited than normal.
The advanced economy central banks are now clearly in easing mode. The Bank of England cut rates earlier this month and the US Federal Reserve is expected to follow course in the Autumn.
Before assessing what impact such cuts might have on the global economy though, it is worth stepping back to examine just how strange this hiking cycle has been.
The International Monetary Fund regularly assesses the health of member state countries and publishes so-called Article IV reports on their current state. These documents rarely make for exciting reading but do occasionally contain the odd nugget of useful information.
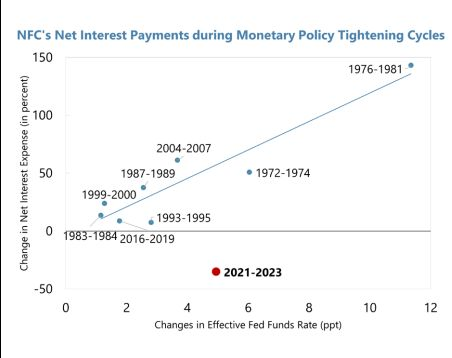
The Article IV report on the United States, published at the end of June contained one chart in particular that caught the eye of Spotlight. It is a simply astonishing image which turns on the head conventional economic thinking.

source: IMF (published 18th July 2024)
It shows the relationship between the change in the Federal Funds Rate (the US’s normal policy rate) and the change in net interest expenses (that is the interest paid less interest received) paid by US non-financial corporations (expressed as a percentage) over the course of the last 8 Fed hiking cycles stretching back forty or so years.
In general, this relationship has been much as one might expect – as the Fed has hiked interest rates, the interest expense born by corporate America has risen. That is how monetary policy is supposed to work; higher rates discourage borrowing and suck up available cash thereby reducing spending power and weakening demand. That lower demand helps to bring it back into touch with supply and should, in theory, reduce price pressures and lower inflation. This is a painful process, but bringing down inflation is worth it in the medium to longer term.
This is pretty much exactly what happened in the seven previous tightening cycles. As interest rates rose, so too did corporate interest expenses. In the case of the 1976-81 cycle interest rates rose by almost 12 percentage points and interest expense shot up by approaching 150%. In the much milder 2016 to 2019 cycle, which was interpreted by the pandemic, rates rose by closer to 2 percentage points and interest expenses by just 15 or so percent.
This time around though, something strange has happened. Fed funds rose by 5 percentage points between 2021 and 2023, the third steepest hiking cycle in the past four decades. If the usual relationship had held then one might have expected corporate interest costs to rise by 50%. Instead though they fell by around 40%.
How on earth has this happened? Two factors lie behind the change. The first is that corporate cash balances in America have been unusually high. That partially reflects the rise of the large tech companies – which tend to be debt light and cash heavy – as a share of the overall economy. But more broadly, corporate investment has been unusually low for almost two decades leading to large buildups of cash on balance sheets. As rates have risen, the interest received on those cash mountains has increased, lowering net interest expenses.
Secondly though, where companies have borrowed they have generally done so on fixed terms – often locking in the low rates on offer in 2020 and 2021.
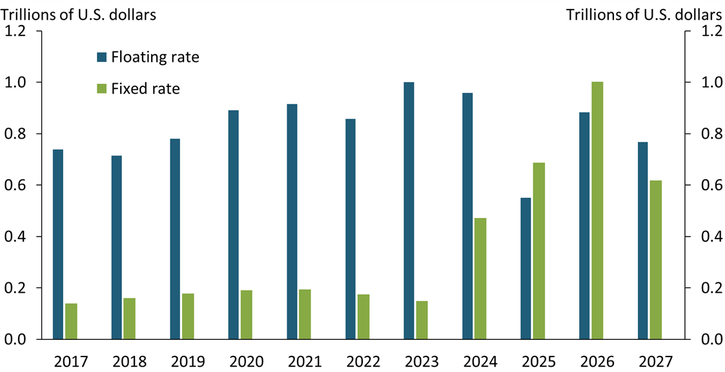
The Kansas City Federal Reserve produced the following useful chart, earlier this year, showing expiring debt contracts due by year over the decade 2017-2027.

source: Federal Reserve Bank of Kansas City (published 2nd February 2024)
As can be seen, around half a trillion dollars of corporate debt – currently at fixed rates – is due to expire this year, around $0.7 trillion in 2025 and over a trillion dollars worth in 2026.
The longer than usual lag in the operation of monetary policy when it comes to corporate America presents the Fed with a couple of new challenges. The first one concerns its current plans for easing. It may be the case that as rates are cut in the months ahead that, at least initially, the lower interest received on corporate cash balances has a larger short term impact than falling debt costs. In other words, actions designed to boost corporate spending power and encourage more demand may have the opposite effect initially. That is a tricky issue to navigate.
More importantly though, with so much debt due to be refinanced in 2024-2026, it is clear that the full impact of the 2021-23 rate rises have yet to be fully felt by corporate America. The Fed may have decided that the economy now requires lower interest rates but many firms will only start to feel the impact of previous decisions in the coming months. Unless the Fed plans on cutting all the way back to zero – which seems deeply unlikely, even the pessimists do not foresee rates going much below 3.5%, then many firms will face a nasty rate shock.
The numbers on corporate America are an extreme example but across the developed world and in all sorts of markets, this monetary tightening cycle has been experienced differently to previous ones.
To pick an example close to home, the UK mortgage market and the impact of changes in monetary policy on households is one clear case.
More than 90% of mortgages taken out since 2015 in Britain have been on a fixed term of two years, five years or even longer. By contrast, as recently as the 2000s and 1990s the majority of mortgages were floating and directly tied to Bank of England monetary policy.
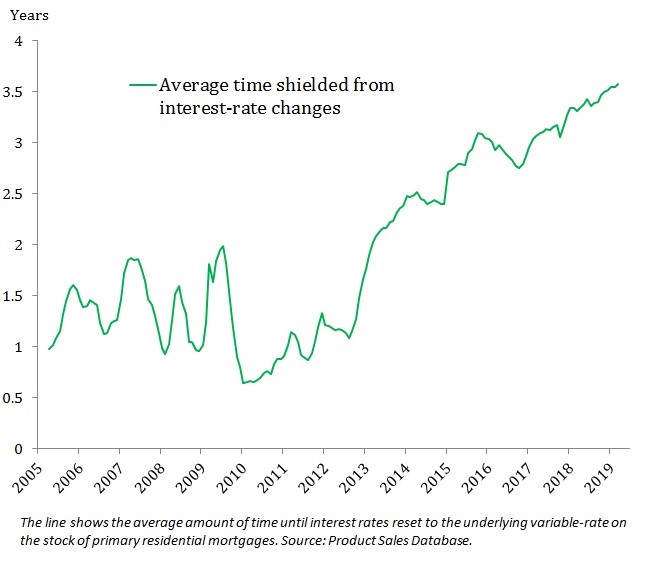
A useful chart from the Bank Of England in 2019 showed some of this effect.

source: Bank Of England (published 27th September 2019)
Twenty years ago, the average mortgagor would have a one year wait before feeling the impact of a change in Bank Rate. By 2019 that had moved up to three and half years. By some estimates that moved to almost four years by 2023.
Like corporate America, many British borrowing have yet to feel the full impact of changes in monetary policy and whilst the BOE might now be cutting, they are likely to find themselves paying more than previously when they eventually do have to remortgage.
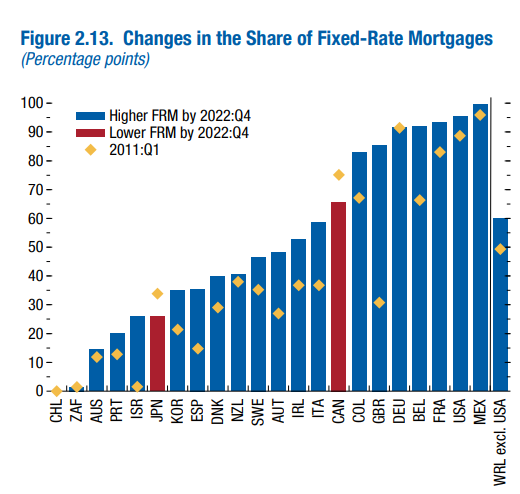
The UK is far from alone in this. This April, the IMF’s World Economic Outlook had a helpful chart, showing the percentage of mortgages fixed in 2022 as compared to those fixed in 2011 by country. Amongst the major developed economies, only in Canada and Japan has that share fallen.

source: IMF (published April 2024)
In other words, monetary policy has become complicated. The usual mechanisms through which it functions, and via which one might expect higher rates to slow spending and lower rates to encourage it, have been somewhat gummed up by a switch to longer-term fixed rate deals in both household and corporate lending and by higher corporate cash balances than normal. The lags have become both longer and, it seems, more variable.
As central banks cut rates in the months ahead it is worth keeping in mind that for many firms and households borrowing costs are still more likely to rise rather than fall in late 2024 and 2025. Driving with a delay on the steering wheel is far from straight forward.
|
What we are watching PMI Day, 22nd August – The global economy is in a strange place. Inflation has fallen sharply but core rates remain too high. Growth seems to be slowing and central banks have begun cutting. The monthly round of purchase managers surveys from manufacturers in the US, Japan, UK and Eurozone should provide a useful snapshot of economic momentum as fears of a slowdown intensify. UK Consumer Confidence, 22nd August – The UK had a robust two quarters of growth to open 2024. Most observers expect a slower finish to the year but with inflation lower, consumers might be happier spending. The GfK survey is the longest running barometer of UK consumer opinion and worth following closely. Jackson Hole, 24-26th August – Each summer the leadership of the Federal Reserve together with selected other central bankers and academics gather for a weekend of reflection on the state of the economy at Jackson Hole in Wyoming. The speeches made there often give a helpful clue to the course of policy in the near term. |
