SORBUS Spotlight: The Year Ahead
The year ahead outlooks from economists, strategists and asset managers that start to appear in mid-November have a somewhat dubious track-record. This time last year the broad consensus was a ‘Trump trade’ that would send the dollar and US stocks, together with crypto, soaring as the new President aggressively cut taxes and regulation whilst going easy on tariffs.
By early April the consensus was turned around – with ultra-tariff rates expected to send US stocks into freefall even as the dollar lost value. As the year comes to an end, neither the ultra-optimism of last December nor the pessimism of early Spring has played out as expected.
Setting out firm predictions for the year ahead is always something of a mug’s game. An often entertaining one but still not the best use of one’s time. So, instead of making some grand calls for the year ahead, Spotlight will end the year by setting out five big questions for 2026.
Will tariffs bite?

source: SORBUS PARTNERS LLP, The Budget Lab at Yale (data as at 17/11/2025)
By any stretch, US tariff rates are high. The chart above, using data from Yale University’s Budget Lab, shows the annual US average tariff rate on goods imports going all the way back to 1790.
That rate has been under 4% since the end of the 1970s and now is above 14% and its highest levels since the 1930s. The contrast with President Trump’s first term is instructive. Between 2017 and 2021 he hiked rates on China – and few specific commodities such as steel – but generally, despite a lot of bluster, stuck to the prevailing rates for most imported goods. This time around countries have been hit by wildly higher import taxes, with even the relative winners facing tariffs of 10% or more.
And yet, the economic fallout appears relatively limited. Given that goods imports were just 4% of US GDP the last time tariffs were this high – compared to more like 11% today – this has surprised many observers.
A few factors perhaps explain the lower fallout from tariffs so far. To start with; whilst the headline rate may be over 14%, the actual rate being charged on many imports remains lower. Large, and important, sectors – such as computers, IT equipment and mobile phones, and pharmaceuticals – have been given carve outs. Some individual firms have also received exemptions in return for pledges to invest in the United States.
But perhaps more importantly, economists in general were probably too quick to assume that higher import tariffs would have a rapid impact on inflation and growth. In reality it takes time for contracts to adjust to sudden changes. Complex cross border supply chains rarely turn on a sixpence. Rather than being felt as a sudden jolt, it may be that the tariff impact plays out slowly over months and even years rather than in days and weeks.
The level of tariffs now feels fairly settled. In 2026, one of the big issues will be whether the price shock associated with their imposition is now complete or continues to roll out at a slower pace.
What happens to the dollar?
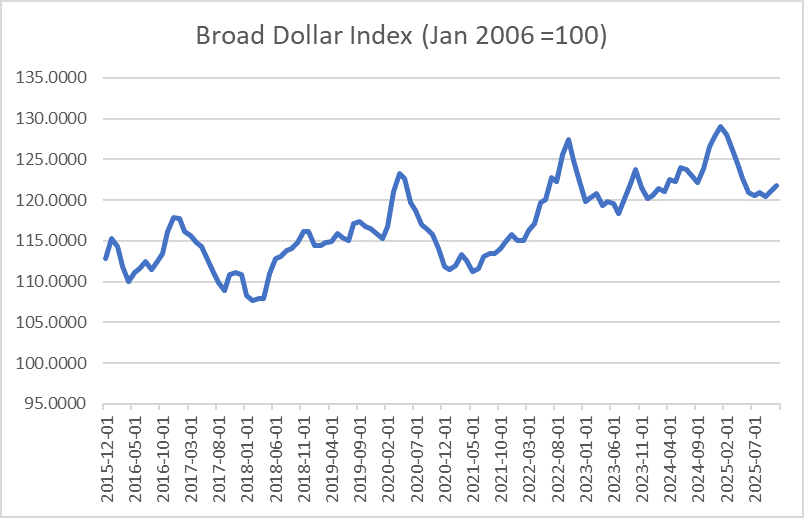
source: SORBUS PARTNERS LLP, Federal Reserve Economic Data (data as at 01/11/2025)
The dollar rose strongly in the final quarter of 2024 as markets began to price in Donald Trump’s victory. The logic behind this seemed sound – the new President would turbo charge US growth, making US equities more attractive relative to those of other advanced economies, that would cause an inflow of foreign money pushing up the value of the dollar. Meanwhile higher Federal deficits – as taxes were cut – would put some upwards pressure on US interest rates, once again a reason for the greenback to rise.
But after the mini-surge in late 2024, the dollar went on to fall by around 7% against a broad basket of other currencies in the first half of 2025 – the currency’s worst start to a year since the 1970s.
It is perhaps underappreciated how much of a helping hand this fall has given the wider global economy. In general, a weaker US dollar tends to be associated with faster global growth. With many global commodities (such as oil) priced in dollars, a falling US currency tends to mean lower effective prices of countries using their own currency. It also tends to ease global financial conditions outside of the United States and to stimulate foreign trade.
Indeed, a case can be made, and has been by bodies such as the IMF, that the fall in the dollar in the first half of 2025 helped to offset the global implications of rising US tariffs.
The dollar is now back in the broad range that characterised much of 2023 and the majority of 2024, where it heads in 2026 could have major implications for global growth.
Can the AI Capex boom continue?
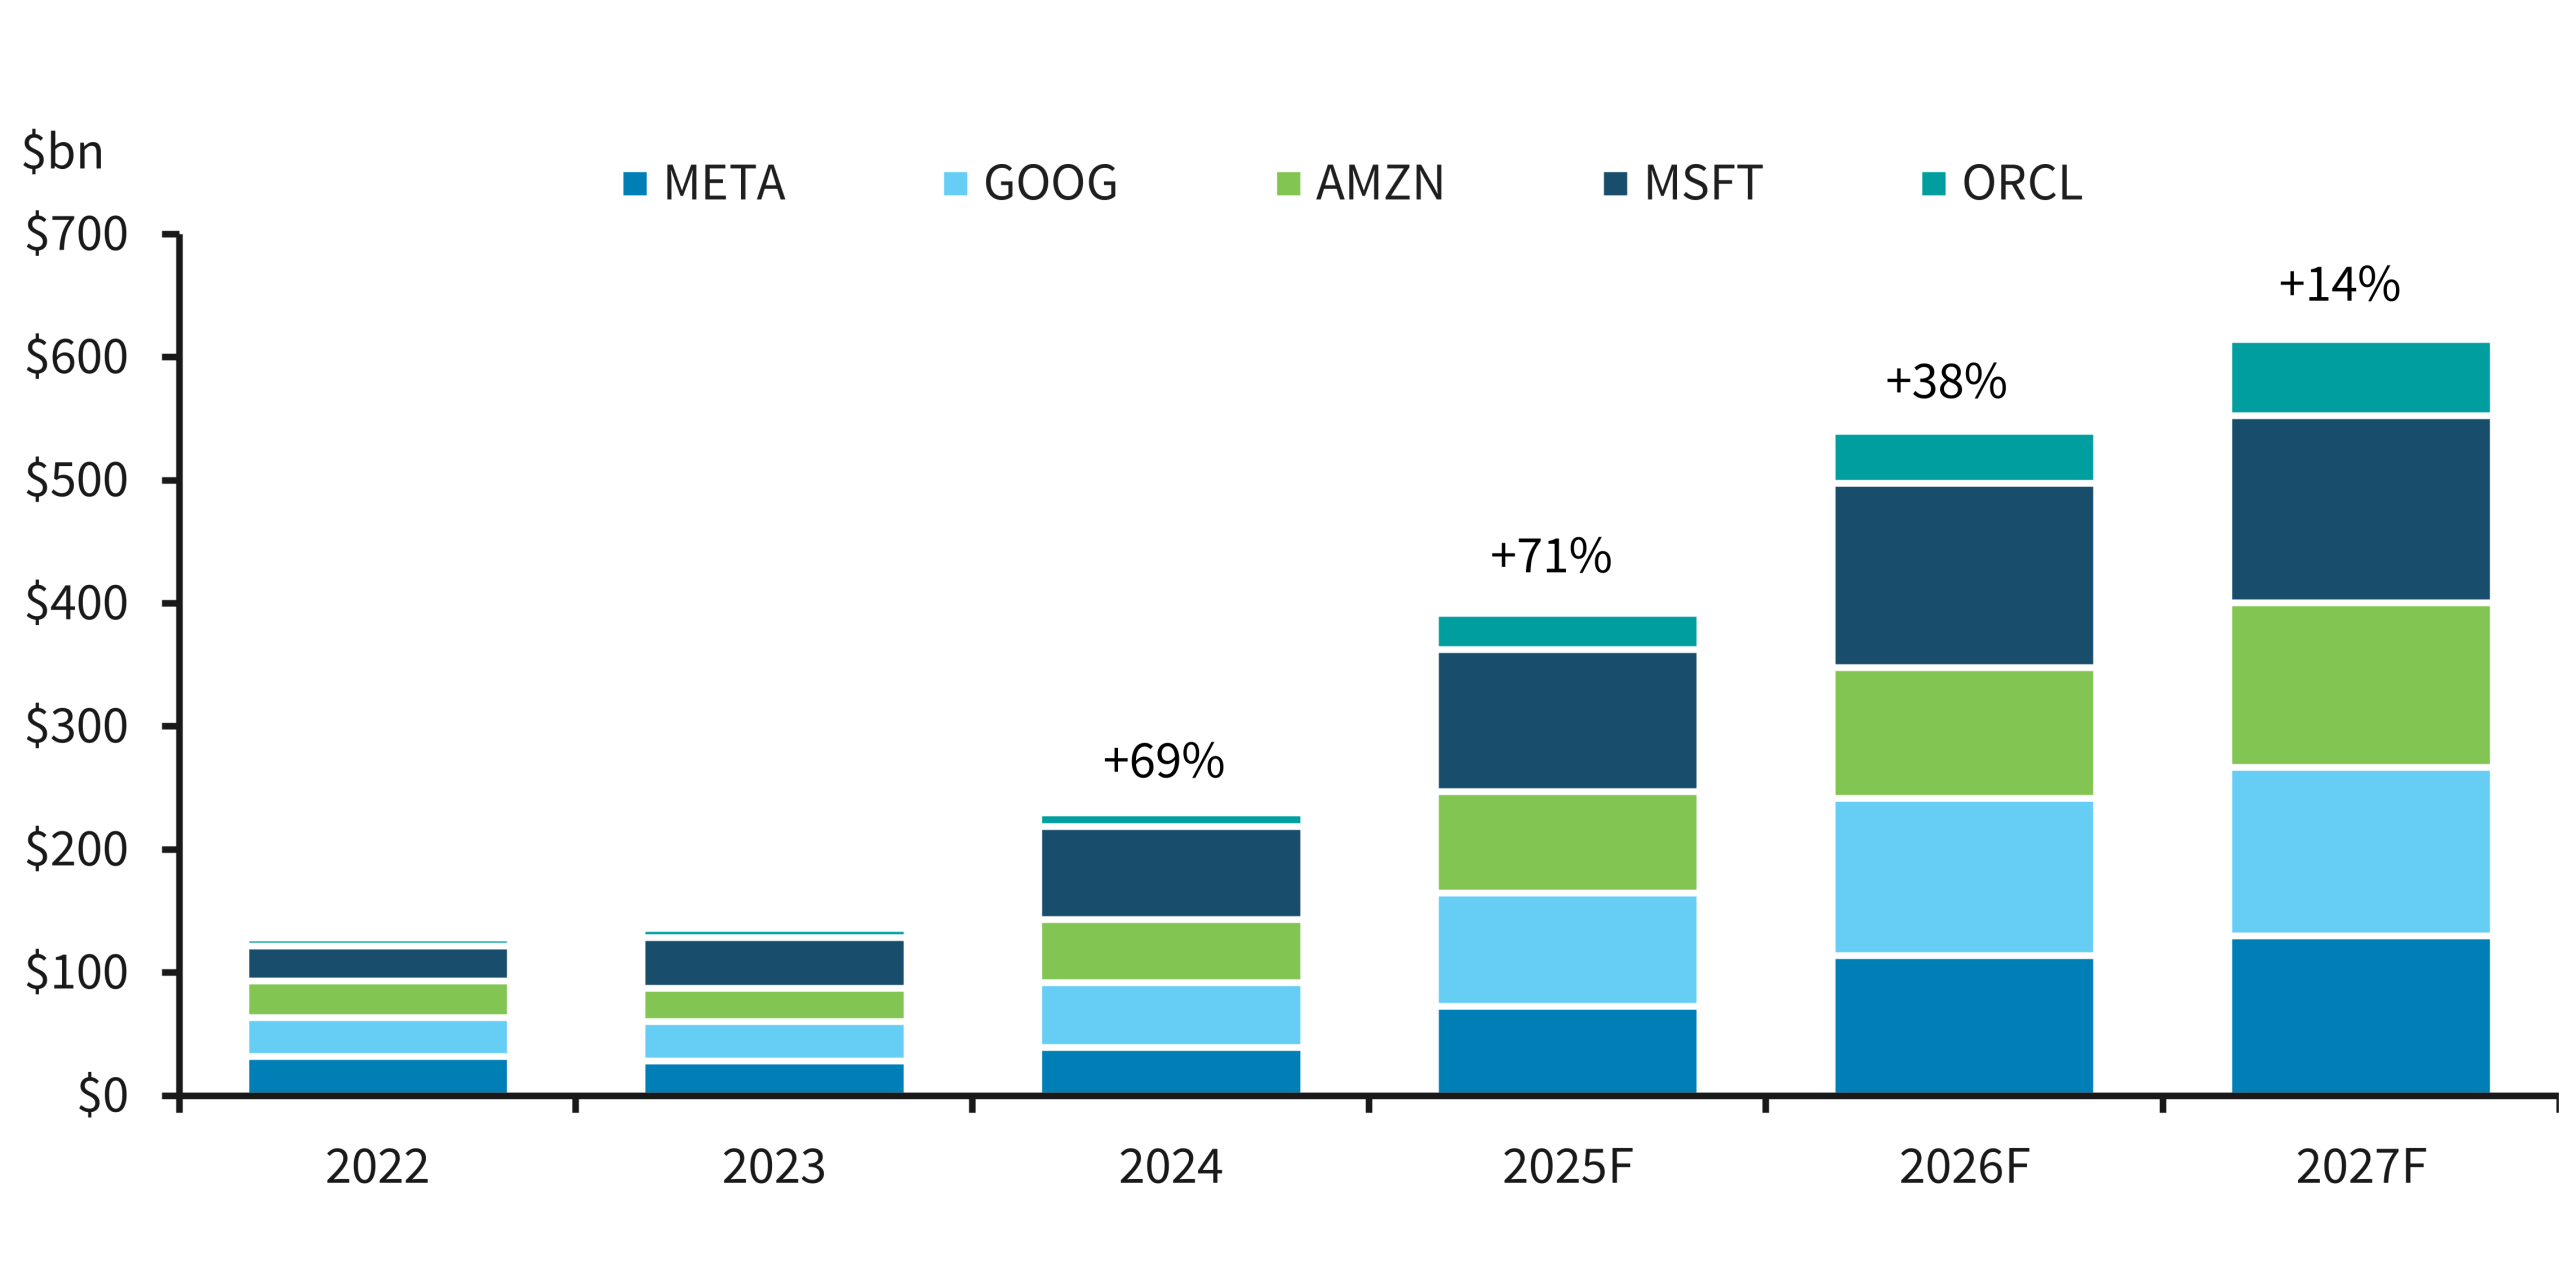
source: SORBUS PARTNERS LLP, Financial Times (data as at 05/11/2025)
Whatever one thinks about the future promise of AI, and whether or not it will revolutionise global productivity growth or lead to huge profits at AI exposed firms, one thing is clear: the amount of money being invested in the hope of it paying off is soaring.
The chart above, pulled together by the Financial Times using company accounts and guidance, shows the recent levels of capital expenditure and planned future investments by the so-called listed ‘hyper-scalers’. Meta, Google (or Alphabet), Amazon, Microsoft and Oracle collectively spent around $100bn annually in 2022 and 2023 on capital expenditure. This year this total is estimated to be $390bn, a staggering increase since the start of the decade. That is forecast to rise to $540bn next year and $615bn by 2027.
And that, it should be remembered, is from five (admittedly large) firms. The total US investment in AI related infrastructure, chips, and model creation, is likely well over one trillion dollars annually.
The economic impact of AI may well turn out to be revolutionary with growth soaring as productivity surges or it could well – much like the internet – turn out to herald a major social change that reshapes business models, but which does not fundamentally turbocharge growth. The answer to that question is unlikely to be much clearer at the end of 2026 than it is at present. Over the next 12 months the most direct impact from AI on the economic outlook – and on financial markets – will likely come from the capex cycle. Will US firms continue to pour money into investment (boosting growth and helping valuations) or will they begin to scale back?
Will China’s trade boom continue?
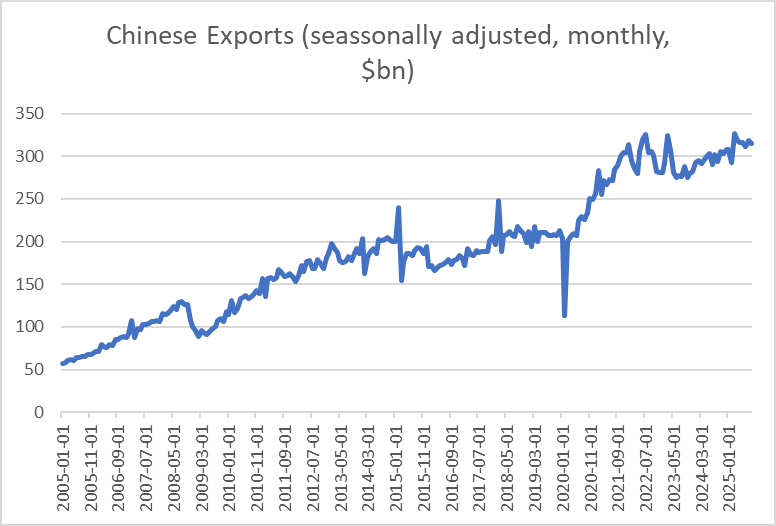
source: SORBUS PARTNERS LLP, Federal Reserve Economic Data (data as at 01/09/2025)
China may have been subjected to the highest tariff levels of any major US trading partner but that has hardly dented the performance of its exports.
Indeed the latest figures show China’s annual balance of trade in goods (exports minus imports) topping one trillion dollars for the first time. Even in global macroeconomic terms, that is a big number.
As the above chart makes clear, Chinese exports rose at a rapid but steady pace from the early 2000s until the early 2010s – with an understandable blip around the global financial crisis. They held steady at around the $200bn a month mark from then until the global pandemic and have surged ever since.
China is now, as German volume carmakers need no reminder, the world’s largest car exporter. It dominates the renewables supply chain. It increasingly challenges Germany, South Korea and Japan when it comes to machine tools. In short it has moved up the value chain whilst still dominating many intermediate sectors.
The US has responded with protectionist tariffs, designed to reduce dependence on Chinese imports and many European politicians are calling the European Union to respond in a similar manner.
Whether China’s surplus can continue to grow will be one of the major themes of 2026.
Is Japan the canary in the coal mine?
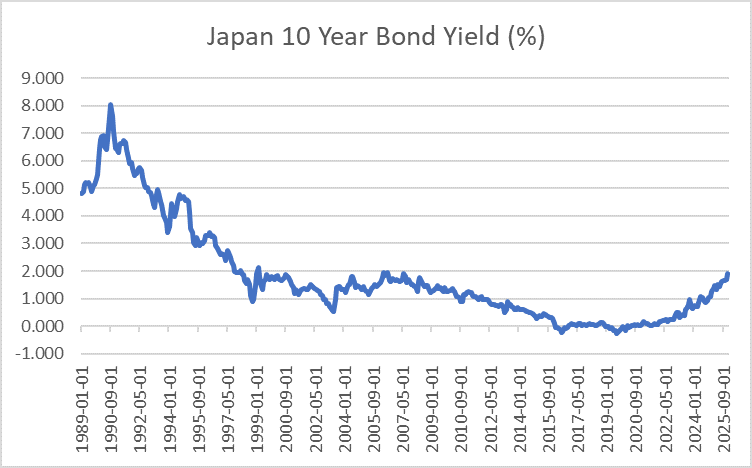
source: SORBUS PARTNERS LLP, Federal Reserve Economic Data (data as at 01/12/2025)
2025 has seen more than its fair share of bond market development. Germany’s decision to drop its tight fiscal targets and to borrow one trillion euros over the coming decade for defence and infrastructure investment saw a sharp rise in German government borrowing costs. A sudden rise in US Treasury yields in April was almost certainly one major reason why President Trump implemented a 90 day pause in the Liberation Day tariffs. And bouts of volatility in the market for British government debt (or gilts) in January, July and November all contributed to the Chancellor’s fiscal space vanishing, forcing yet more tax hikes.
But the real, although quieter, drama has been in Japan. Japanese yields have almost doubled this year and do not seem to be slowing down.
For decades, shorting Japanese government bonds was known as the widow-maker trade. All of the fundamentals seem to point to higher yields, Japanese government debt was, after all, sky high. And yet, for decades, the yield ground lower. By 2019, the yield on a Japanese ten year bond was negative in nominal terms despite a debt/GDP ratio of over 200%.
Now though Japanese rates, long the lowest of any advanced economy, are powering higher. If even Japanese bonds can fall and yields can rise, could other government borrowing costs reassume their ascent? That is something worth watching in 2026.
|
What we are watching. UK retail sales, Jan 6th – The British Retail Consortium will give the first real clue as to how the vital Christmas trading period went for British retailers. With GDP slipping in October (the latest figures available), worries about the health of the British consumer have come to the fore. Chinese trade, Jan 8th – China’s trade balance, as discussed above, will be one of the major things to watch in 2026. Eight days into the year the first update will become available. US Jobs, Jan 9th – The jobs market is increasingly hard to read. Hiring seems to have slowed sharply but lay-offs seem contained. Wage growth has slowed but is still faster than the Fed is comfortable with. The prospects for US rates depend on how the next few months play out in the labour market. |