SORBUS Spotlight: The new global economy
April saw the release of the International Monetary Fund’s latest forecasts. These tend to get a fair bit of attention from both analysts and the media. Whilst the IMF is neither more accurate nor less accurate than other economic forecasters, its World Economic Outlook forecasts at least have the advantage of providing comparable forecasts for all the world’s economies at the same time. That inevitably leads to temptation to cover them in the form of league tables of growth, to see how the UK is performing relative to, say, Germany or France.
These forecasts were notable in that the standard five-year view given by the Fund, for the first time, now covers the remainder of the 2020s.
Sometimes it is worth steeping back for a moment and looking at the bigger picture. The IMF’s data series begin in 1980, so by plugging in the historical outturns back to 1980 and the forecast numbers for 2025 to 2030 one can take a look at fifty years of economic history in one chart.
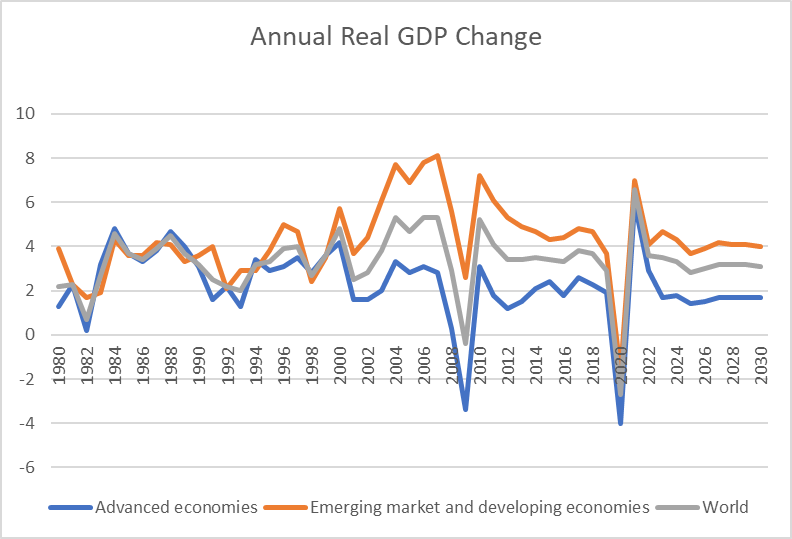
source: SORBUS PARTNERS LLP, IMF (data as at; 19/06/2025)
Given that recessions make this chart a little hard to follow, the chart below uses a five year rolling average to smooth out some of the fluctuations.
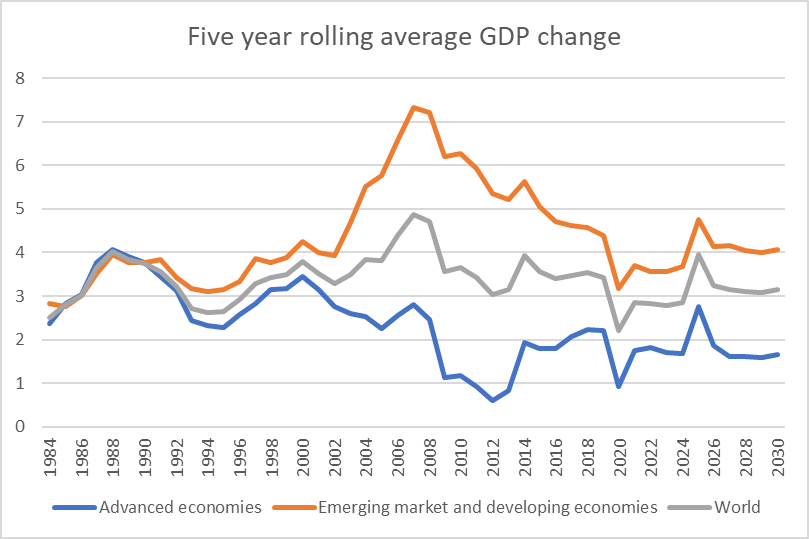
source: SORBUS PARTNERS LLP, IMF (data as at; 19/06/2025)
The first thing which leaps out is that the pattern of growth – with emerging markets growing by around 4%, advanced economies by closer to 2% and the world as a whole by around about 3% has now been an established pattern which has lasted for more than a decade and half and is set to continue for the rest of this decade.
In other words, emerging economies growing about twice as fast as developed ones has become the new normal. But this was not always the case. As the charts make clear throughout the 1980s the growth rates were roughly similar and, well into the 1990s, the emerging outperformance, in raw growth terms, was much less spectacular.
Sitting behind these numbers are the strong growth of China since the late 1970s and, since 2008, the relatively poor performance of European advanced economies (including Britain). China has provided an important prop to emerging market growth in general whilst Europe has acted as a drag on the advanced economies.
That said, the story is bigger than just China and Europe. Growth in emerging economies in general – from Asia to Africa to Latin America – has improved in recent decades whilst even in the relative world leader – the United States – growth rates have tipped since the financial crisis.
Putting the numbers into decade averages makes the pattern even clearer.
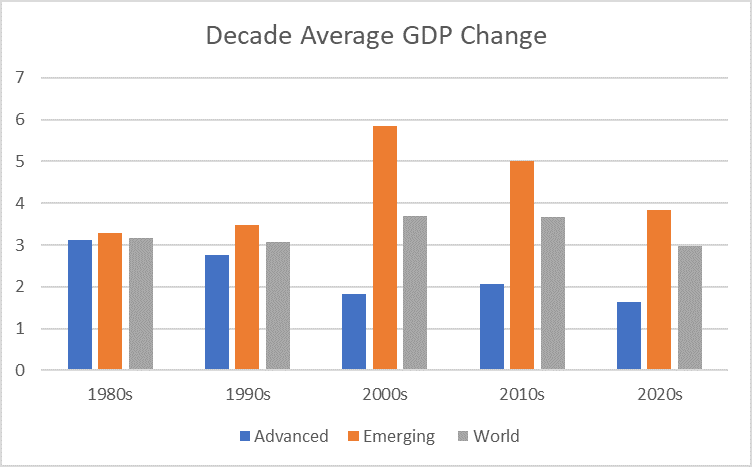
source: SORBUS PARTNERS LLP, IMF (data as at; 19/06/2025)
On the basis of the IMF’s five year forecasts the 2020s will see the weakest growth amongst the advanced economies as a whole in five decades. And whilst the emerging economy will also slow, relative to the 2010s, it will remain at a much brisker pace.
The impact of these changes, slowly playing out over decades, is best demonstrated by a simple chart.
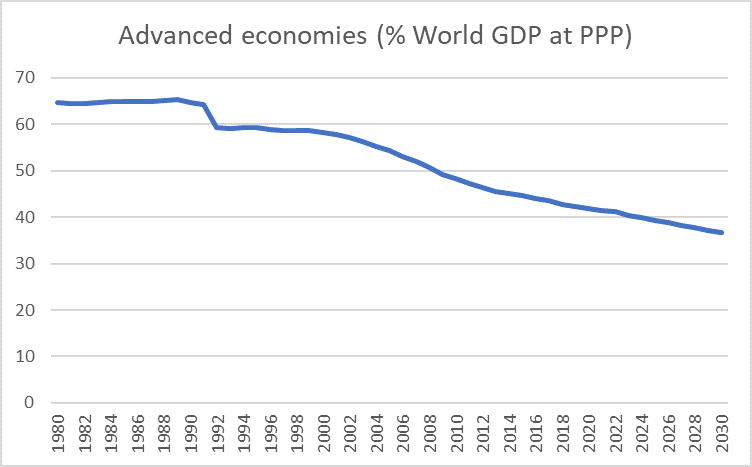
source: SORBUS PARTNERS LLP, IMF (data as at; 19/06/2025)
This shows the advanced economies as a share of world GDP adjusted by purchasing power parity (PPP) which controls for differing purchasing powers across nations and represents the single cleanest measure of total economic weight.
As is clear, those decades of outperformance by emerging economies – relative to their advanced peers – have added up over time.
At the turn of the century, the advanced economies still made up almost 60% of global economic activity. Even as late as 2008 they represented just over half of global output. Nowadays their share has fallen to just under 40% and that is expected to drop to more like 36% by 2030.
Of course even a 40% share in world economic output still means their advanced economies punch above their weight. On the IMF’s definition for example, the advanced economies have a population of around 1.1 billion as set against 6.9 billion in the emerging world. 40% or so of global GDP being produced by under 15% of the globe’s population is still an impressive performance. It is just nowhere near as impressive as the ratio found in the 1980s or 1990s.
The global economy is now led by emerging markets. Indeed since 2010 demand from emerging economies – and not just China – has been a larger factor than demand from advanced economies in the markets for oil, natural gas and most industrial metals. In other words the old mental model of the world, in which emerging markets – in general – produced commodities and advanced economies consumed them no longer holds. The old logic that rising commodity prices were, in general, a boon for emerging markets is no longer necessarily true. The world is a more complicated place.
Intra-emerging market – i.e. the trade of emerging markets with each other – has also risen sharply. As recently as the year 2000, only around one quarter of the exports of emerging market economies went to other emerging markets. Nowadays that is more like 50% and growing much faster than their trade with developed countries.
For all the attention lavished on US tariffs they may well simply not matter as much to the outlook for global trade as they would have done even a decade ago.
The real global economy is increasingly dominated by emerging economies which increasingly trade with each other and consume commodities as well as producing them. And yet the global financial system has not kept pace with these changes.
To take equity markets, as the easiest example, total developed market capitalisation (as of late 2024) was around $73 trillion whereas the total market capitalisation of emerging economies was ‘just’ $42 trillion.
The advanced economies then represent around 15% of the world’s population, 40% of its economic activity and yet more than 60% of its equity market capitalisation.
There are, of course, reasons why one might expect developed market equities to hold a greater share of the world’s total than their economic footprint. For starters, many developed world based companies operate extensively in emerging economies and are exposed to those markets. Although, as the experience since 2020 of German auto producers suggests, emerging market based competitors are increasingly capturing market share at their expense. Secondly, equity markets are a less developed tool of financing in many emerging markets. State or privately held companies usually make up a larger share of domestic economies than is common in the West. Finally, weaker corporate governance standards, weaker company law in general and less secure property rights all mean that emerging market listed firms all often trade at a discount to their advanced economy peers.
All of these reasons are valid. But it is hard to see how the market capitalisation gap can remain so much larger than the economic activity weight in the long run. Over time, as has happened in patterns of economic output, trade and commodity usage the financial markets will shift towards the emerging world.
Thirty years ago anyone with a handle on the outlook for the United States, Japan and the larger Western European economies had a reasonable feel for the global economic outlook and the likely performance of global markets. That is no longer the case. Investors have gotten used to the idea that China matters over the last couple of decades but even that is no longer enough. Emerging markets, in general, matter more than they ever have. They represent the bulk of global economic activity, they increasingly trade with each other and their role in global finance markets will only grow from here.
|
What we are watching. Australian Trade, 3rd July – Australia is an open economy which exports a great many commodities and imports a wide range of consumer goods and capital equipment. It also produces trade statistics in a timely manner. Because of this it is a useful barometer to watch in order to gauge the state of global trade. The May figures will give a sense of how much the April Liberation Day tariffs are affecting trade outside of the United States. BRC Retail sales, 7th July – The British Retail Consortium’s sales data have a smaller sample coverage than the comparison data from the Office for National Statistics but they are much more timely. On July 7th the figures for June will be released, ahead of even the release of the May numbers from the ONS. Retail sales remain the single best snapshot of the state of mind of British consumers. Chinese inflation, 9th July – How bad has the hit from extremely high US tariff levels been on the Chinese economy? Whilst trade talks have seen headline rates reduced, for most of May – the period covered by these figures – the US was charging a tariff of more than 140% on most Chinese goods. That may have added to domestic disinflationary pressures. |