SORBUS spotlight: the destination and the route
The global rate hiking cycle is picking up the pace. At its last meeting in mid-June the US Federal Reserve raised its benchmark rate by 0.75%. Until a well-timed briefing to the Wall Street Journal, just days before the meeting, markets had been expecting a 0.5% move. In recent speeches Fed policymakers have been keen to emphasise that another 0.75% move is still on the table for the forthcoming meeting. The Bank of England too has been debating moving faster. Whilst the Monetary Policy Committee settled on a 0.25% increase in Bank Rate at their June meeting, three of the nine members voted for a 0.5% move.
The pace of monetary tightening no doubt matters but over the past few weeks it has come to dominate market and economic commentary to a perhaps unhelpful extent. There has been too much discussion of the route central banks are taking and not enough focus on the final destination. In the medium term what really matters is the level that central banks feel they have to get interest rates to, not how quickly they get there. In the sometimes-obscure language of central banks, this is usually referred to as the terminal rate – the end point of the hiking cycle.
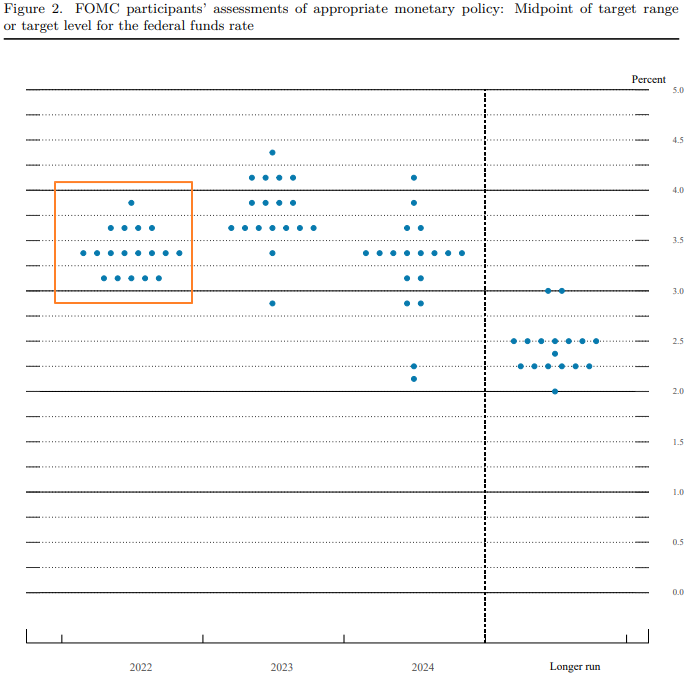
Working out what the terminal rate will be is far from straightforward. The Federal Reserve is perhaps the most transparent of the major central banks. Four times a year the members of its rate setting committee publish their estimates of how high rates will be set in the future. The resulting chart is often called the ‘dot plot’ and can be tricky to interpret.

The US Fed Funds rate is currently at 1.75%. And all of the members of the rate-setting Federal Open Market Committee expect it to be over 3% by the end of the year. The majority of FOMC members expect the peak to come in 2023, probably somewhere between 3.5% and 4%. Rates will then, probably, stay around 3.5% throughout 2024 before gradually returning to a longer rate somewhere between 2% and 3%.
The details are imprecise. This is less of a modern road atlas to the destination and more akin to a pre-modern map, with vague outlines and many parts which require filling in. Still, at least the Federal Reserve provides some form of directions.
What makes the dot plot useful, is the ability to compare the current distribution of the dots to previous iterations. That gives some sense of how the thinking of the FOMC is evolving with the economic data.
Comparing the most recent plot to the one from six months ago is instructive.
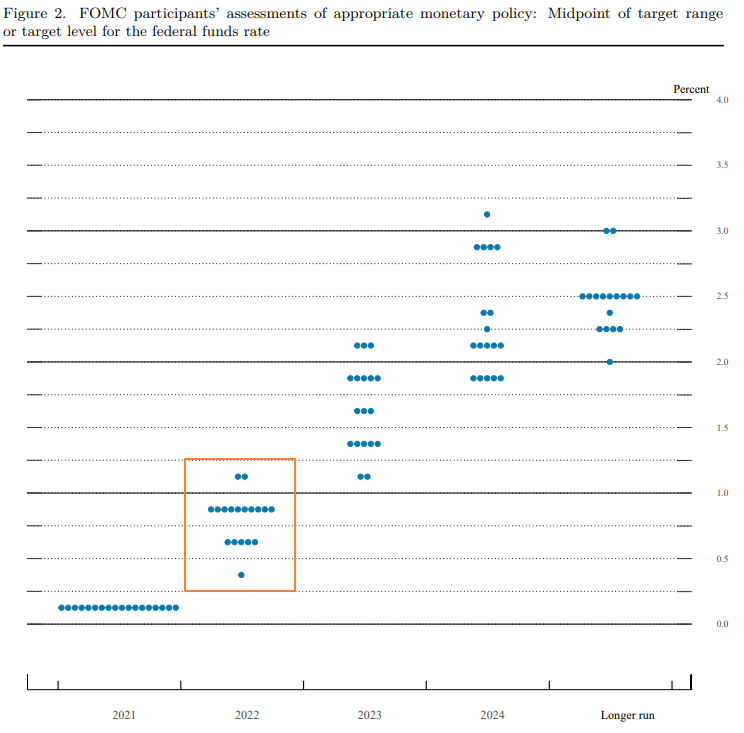
As recently as December 2021, the Fed was still guiding that rates would be sub-2% by the end of this year. Clearly a lot has changed. Not only is the pace of hiking now expected to be more rapid, but the peak is higher too – even if the longer terminal rate remains essentially unchanged.
Whilst the Fed’s dot plot is not exactly a precise guide to the path of monetary policy, it’s at least something tangible that can be analysed. Neither the Bank of England nor the European Central Bank provide anything comparable.
To work out the terminal point for British rates – and indeed other sets of rates – one needs to return to first principles.
There are three variables to consider: how high inflation will be, how tight monetary policy has to become and, the trickiest of all, what level of interest rates would be ‘neutral’.
To begin with the most straightforward variable; the rate of inflation clearly matters to the terminal point of interest rates. Central banks, though they often talk about the nominal level of interest rates, tend to conduct their economic analysis using the real interest rate, that is to say the level of rates controlling for rising prices. If inflation is expected to be 2% next year and interest rates are set at 2.5% then the expected real rate is 0.5%. If inflation expectations tick up 3% then the expected real interest rate will fall to -0.5%. If the central bank believes that a real rate of 0.5% is appropriate, then nominal interest rates will have to rise by 1% to maintain the same real rate.
Much of the change in the Fed’s dot plot over the past six months simply reflects inflation running well ahead of where the Fed expected it to be.
The second and third variables are far less straightforward and closely interrelated. The ‘appropriate’ level of rates is really a question of just how tight the central bank thinks monetary policy has to become to slow growth, investment and spending to a degree needed to return inflation to its target. Central banks usually analyse this by reference to what they call the neutral rate, or, in the strange language that is economese “r*”.
The neutral rate, or r*, is the real interest rate at which the central bank is neither stimulating the economy in order to increase inflation nor slowing it to reduce the rate of price increases. It’s best thought of as the precise point on a shower dial at which the flowing water is neither too hot nor too cold. And just like getting the temperature precisely right on a shower, finding it is not easy.
The neutral rate is not some unchanging number. Instead it is impacted by wider changes in the structure of the economy.
Eight years ago Mervyn King, an ex-Bank of England governor, noted that real rates had been falling across the globe – both advanced and emerging economies – for decades.
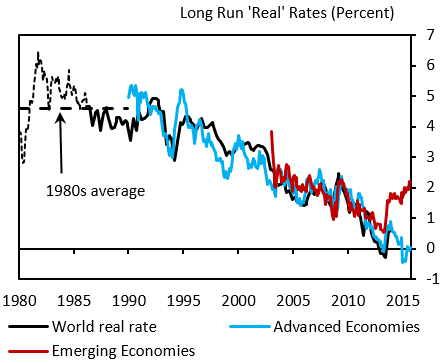
Much of that fall, central bankers tend to believe, reflects a long-term fall in the level of r*. Some call it a 3D view: with the drivers being the three Ds of demographics, debt and the distribution of income.
Taking each in turn. Demographics shape how a society saves and spends. In general people accumulate savings over the course of their working career and then run them down in retirement. As the median age of citizens in advanced economies has risen so too have their desired levels of saving. All things being equal, to use a favourite expression of economists, as desired savings rise the neutral level of interest rates will fall. If people, in general, are keener on saving and less keen on spending than they were, then they save more at lower levels of interest than in the past.
Debt matters too. As debt levels – at the household, government and firm level have risen across the advanced economies then the impact of interest rates has been magnified. To use a household example – a family with a mortgage of £100,000 might shrug off interest rates of 5% whilst a family with a similar level of income but a mortgage debt of £500,000 would be less relaxed. Global debt levels, as a share of global income, have risen rapidly for decades.
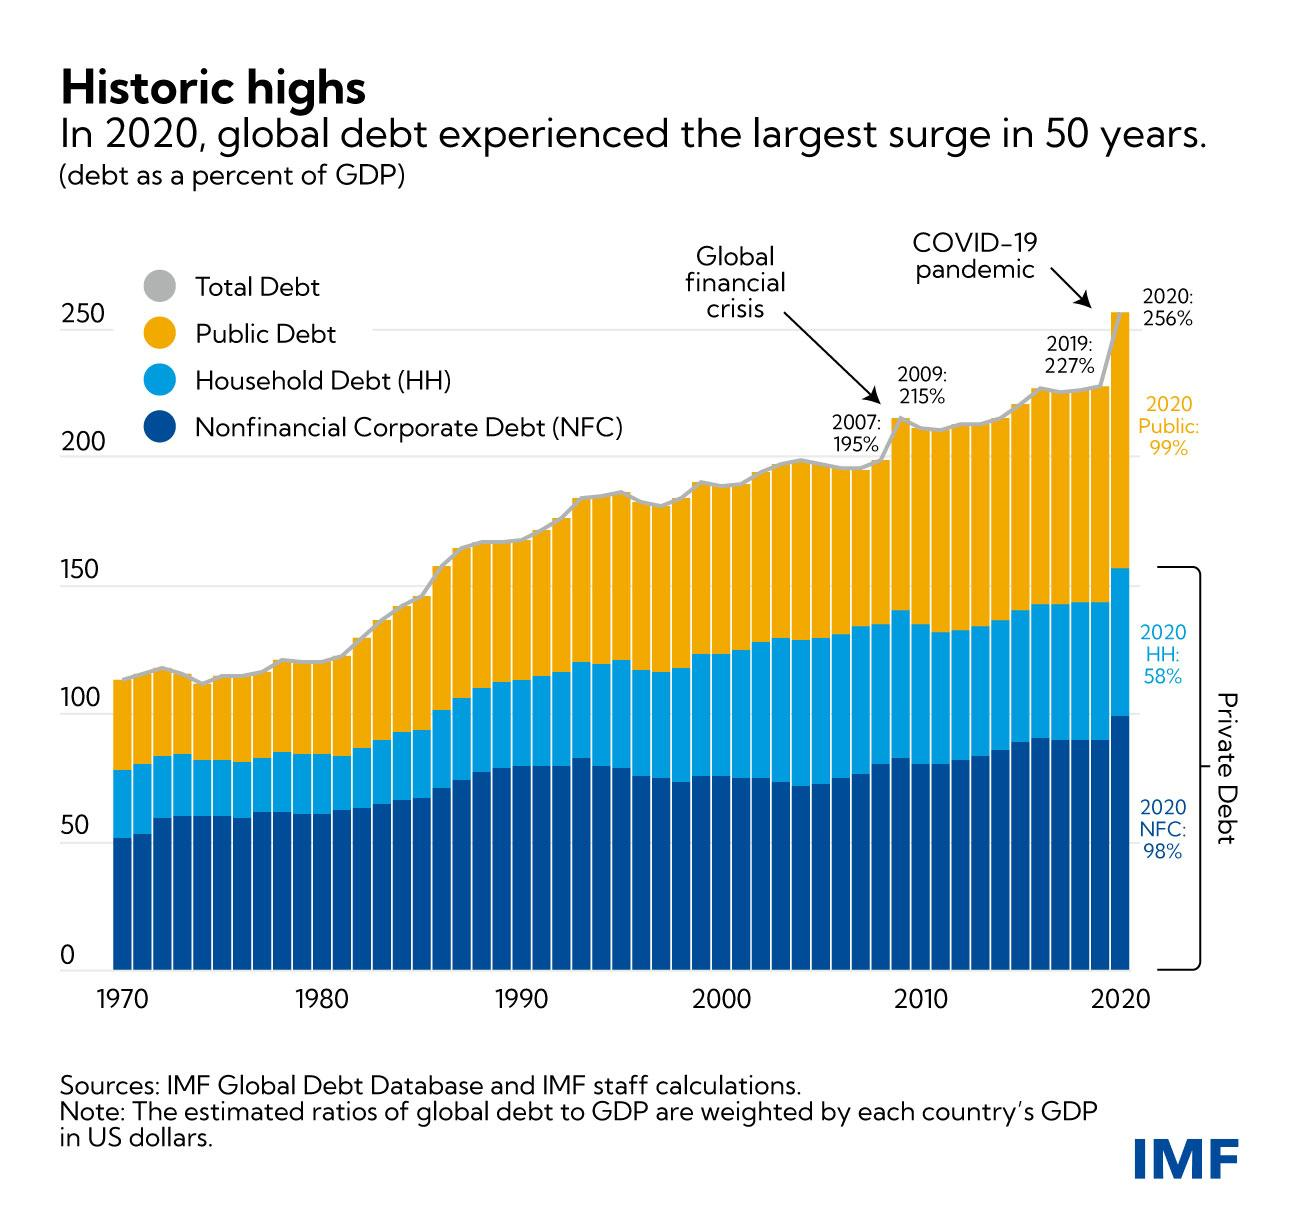
Higher debts mean lower neutral rates – rates do not have to rise as far as in the past to become restrictive.
Finally, the distribution of income matters. The impact here is similar to that of demographics. In general saving is a luxury good – people do more of it as they earn more. As the distribution of income has become more unequal across the Western economies, the overall level of desired saving has increased.
Taken together the “the three Ds” all point to a lower neutral rate of interest than in the past.
And whilst much has changed over the course of the pandemic, the messy recovery and the uncomfortable inflation of the last few years, those fundamental drivers – ageing societies, high debt and a changed distribution of income – remain much the same. It is no real surprise that despite rapid shifts in the Fed’s dots for 2022, 2023 and 2024 the FOMC members continue to believe that the level of rates in the longer term – at around 2.5% in the US – has not shifted much.
So how high will interest rates peak?
That of course depends on quite how high inflation goes and how long the spike persists but a reasonable answer remains ‘lower than in the 1990s but much higher than experienced in the last fifteen years’.
COMING UP
US Inflation, 13th July. The US is further ahead on the inflationary cycle than Europe and many analysts had hoped that inflation had already peaked in the late Spring. But rising energy prices have dashed those hopes. Not only are petrol prices still increasing but Europe’s increasing reliance on US LNG imports to replace Russian gas has started to restrict supply domestically in America and push up domestic energy prices. Another strong reading could push the Fed towards more 0.75% moves. British Jobs data, 19th July. At the headline level Britain’s jobs market remains tight. But timely data shows some signs of softening – excluding bonus payments wage growth has begun to moderate and the online recruiters report falling levels of job ads. The Bank of England is watching the labour market closely for signs of inflationary pressure. Any weakness could well slow the pace of rate rises. European Central Bank, 21st July. The ECB has been late to the rate rising party. But this month is widely expected to see the first ECB rate increase in a decade. More interesting than the actual decision – which has been widely flagged in advance – will be the press conference. With other central banks hiking rapidly, President Lagarde is expected to give a clearer timetable for more hikes in the second half of the year. |